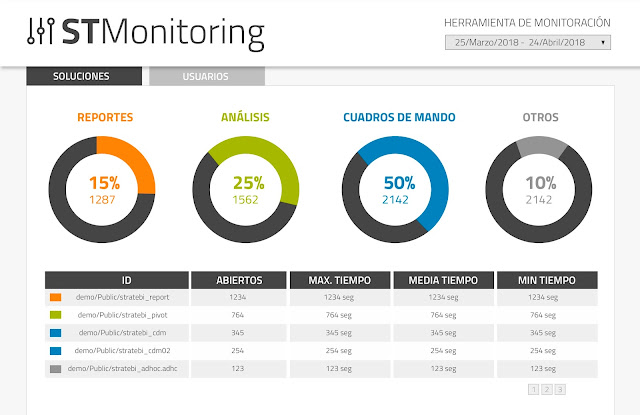
One of the things more useful when you are running a Pentaho production environment with a lot of users accessing the BI server, using reports, dashbords, olap analysis... is monitor the whole user performance.
That´s why we´ve created STMonitoring (included free in all of the projects we help to develop and in some solutions, like LinceBI). It includes a set of predefined dashboards, reports and olap analysis based on several monitoring models including:
User session events model:
- Analysis by year, month, day, hour and minute
- Session event (login, logout)
- User
- Session status (abandoned, ended, started)
- Session Duration
- Session Avg Duration
- Session Max Duration
- Session Min Duration
- Session Count
- Acc. Login Count by Time
- Avg. Login Session Count by Time
- Max. Login Session Count by Time
- Acc. Logout Count by Time
- Avg. Logout Session Count by Time
- Max. Logout Session Count by Time
- Concurrent Sessions Count by Time
Server Content access model:
- Analysis by year, month, day, hour and minute
- User
- Content type (CDE, Pentaho Analyzer, CDE, Saiku Analytics, STPivot, STReport, STDashboard, Pentaho Reporting, STAgile...)
- Content extension (prpt, wcdf, xaction, xjpivot...)
- Content (complete path)
- Duration
- Avg duration
- Access count

Want to know more? send an email


