Quantcast
Channel: Business Intelligence y Big Data: ¡Aprende Gratis sobre Analytics!
Viewing all 866 articles
Browse latest View live

eBook gratuito: Data Driven, Creating a Data Culture de O'Reilly

$
0
0
http://www.oreilly.com/data/free/data-driven.csp


Description
Succeeding with data isn’t just a matter of putting Hadoop in your machine room, or hiring some physicists with crazy math skills. It requires you to develop a data culture that involves people throughout the organization. In this O’Reilly report, DJ Patil and Hilary Mason outline the steps you need to take if your company is to be truly data-driven—including the questions you should ask and the methods you should adopt.
You’ll not only learn examples of how Google, LinkedIn, and Facebook use their data, but also how Walmart, UPS, and other organizations took advantage of this resource long before the advent of Big Data. No matter how you approach it, building a data culture is the key to success in the 21st century.

Download

You’ll explore:
  • Data scientist skills—and why every company needs a Spock
  • How the benefits of giving company-wide access to data outweigh the costs
  • Why data-driven organizations use the scientific method to explore and solve data problems
  • Key questions to help you develop a research-specific process for tackling important issues
  • What to consider when assembling your data team
  • Developing processes to keep your data team (and company) engaged
  • Choosing technologies that are powerful, support teamwork, and easy to use and learn
Machine Intelligence Landscape

Dashboards using ascii/ansi

Tarjetas Black de Bankia, Analytics

$
0
0
www.tatopagao.es

Tatopagao es un buen ejemplo de aplicar datos abiertos, business intelligence y open source, como herramienta para los periodistas de datos y ciudadanos en general en busca de transparencia. 

Una web que permite realizar análisis, informes y cuadros de mando, empleando soluciones de data discovery, basada en la solucion Pentaho Open Source.

Estos son algunos de los ejemplos que se pueden crear:


Errores comunes en la visualizacion de datos

Informe sobre Digital, Social y Mobile en 2015

$
0
0
Buen estudio por paises, el recientemente presentado por we are social, con datos más que interesantes y estadisticas globales


Segundo Meetup Pentaho en Madrid, 26 de Enero

$
0
0

Para todos los apasionados de Pentaho, Saiku, Ctools, Big Data y Open Source en general llega para el próximo lunes 26 de Enero en Madrid el 2º Meetup de Pentaho, que coordina Rafael Valenzuela

No te lo pierdas!! apuntate... que ya te estamos avisando

Agenda:

1.- Emilio Arias: New Pentaho CE improvements for Open Data applications
2.- David fombella: PDI metadata injection and advanced etl techniques
3.- Matt Casters Creador de kettle : Sorpresa, Sorpresa...
4.- Rafael Valenzuela *: Saiku addons


Edificio de Telefonica (Tuenti)

Tuenti Calle Gran Vía, 28 28013 Madrid,

Big Data 2014: A year in review

$
0
0
Good review of the most important facts during 2014 about Big Data. If you work or are interested in Big Data, this recap is a must.

Hadoop, Spark, Cassandra, MongoDB, Hortonworks, Pentaho, Vertica, Cloudera, Apache Flink, CouchDB and more...


España 2015, uso Digital y Social Media

$
0
0

Que penetración y uso tiene el Social Media y el área Digital en España? Os mostramos un buen puñado de estadísticas actualizadas. 

Desde TodoBI y Stratebi hemos usado el BI Open Source para crear soluciones de Social Intelligence, lo que permite analizar todas estas montañas de información con tecnologías Big Data


Visto en we are social

Nueva version de GoogleVis

$
0
0
The googleVis package provides an interface between R and the Google Charts API. It allows users to create web pages with interactive charts based on R data frames. Charts are displayed locally via the R HTTP help server. A modern browser with Internet connection is required and for some charts a Flash player. The data remains local and is not uploaded to Google.

You find examples of all googleVis function on CRAN. Perhaps the best known example of the Google Chart API is the motion chart, popularised by Hans Rosling in his 2006 TED talk

Tutorial GoogleVis 

Las mejores visualizaciones de Diciembre

$
0
0

Popular Science | '15 charts, graphs and maps that will shape the future of information.'
Bloomberg | '2014 Is Likely to Be the Earth's Hottest Year Ever. Why It Doesn't Matter' - love the plot half way down
Washington Post | Inevitably, being December, there were several 'Year in graphics' collections. Here's one from the Washington Post...
New York Times | ...here's the New York Times'
Quartz | ... and from Quartz
Zeit Online | ... this one from Zeit Online
Reuters | ...next up is the Reuters graphics collection
WSJ | ...The WSJ's year of interactive graphics
CartoDB | Rivers in the US coloured by the direction in which they flow
NZZ | In contrast to the previous links, this is an interactive visualisation chronicling and analysing a year of published content
Senseable | 'Art Traffic at the Louvre: A study of visitors’ behaviour using Bluetooth data'
Marion-Luttenberger | Interesting portfolio of creative, physical/ambient infographic work
Washington Post | 'Most Americans’ best days are behind them'
The Bump | Nice way to show the relative size of a baby week-by-week
Wired | 'A Web App That Visualizes Wikipedia as a Starry Galaxy of Articles'
BBC | 'Jihadism: Tracking a month of deadly attacks'
Bloomberg | 'Pain at the Pump: Gasoline Prices by Country
Buckets | Terrific interactive NBA player dashboards
New York Times | 'A Record Year for Auto Recalls'
Creative Review | 'The soundscape of New York' - physical visualisations
Eye See Data | A really terrific detailed bump chart showing the history of Fifa World Rankings
Bloomberg | More interactive storytelling excellence from the Bloomberg Visual team, this one profiling 'Climate Change in Perspective'
Muyueh | A deep exploration into how 'Different languages have different ways to describe color'
Boston Globe | 'This is how Congress connects on Twitter'
Tabletop Whale | Animated infographic showing 'How to build a human'
ProPublica | 'Inside the Firewall: Tracking the News That China Blocks'
On Broadway | 'The interactive installation ON BROADWAY represents life in the 21st-century city through a compilation of images and data collected along the 13 miles of Broadway that span Manhattan.'
Washington Post | 'The brutal methods outlined in the Senate report'
ncase | Enjoyable 'segregation simulator' - "This is a story of how harmless choices can make a harmful world".
Wired | From MapLabs: 'Our Favorite Maps of the Year Cover Everything From Bayous to Bullet Trains'
The Acme Catalog | 'BIG BATS is a search through historical data (1903-2013) for performances by players who seemed like they were literally playing with a larger bat than everyone else.'
FiveThirtyEight | Love this analytical enquiry: 'The Final ‘Hobbit’ Film Is An Unprecedentedly Gratuitous Stretch Of Source Material'
TheUpshot | 'The Vanishing Male Worker: How America Fell Behind'
Truth and Beauty | Love these remixes of Hans Rosling's famous graphics, redesigned for print
City Geographies | 'Understanding Household Energy Use in England & Wales'
What Color Is It? | 6 digit time converted in to a hex coloured background that constantly changes as time does. Dead simple. Dead good.
New York Times | 'What We’re Searching For'
WSJ | 'Who's News: Rank business leaders on the Journal's influence grid.'
Tableau Public | The remixer becomes the remixed... A stunning reworking of Moritz Stefaner's 'Notabilia' by Mark Jackson
NZ Herald | 'Visualising 268,000 tonnes of floating plastic in the world's ocean'

Recopilacion de Visualising Data

Great to see Jedox Planning and Forecast in action, new 5.1 features

$
0
0
In Jedox, by combining future-oriented forecasts and plans with systematic analysis of historical data you get 360-degree view of your organization. 


For Jedox 5.1,  you can easily lock or unlock individual cells or entire planning areas on any planning template. 
The new 'Lock Jedox Cell' means you can hold data constant while planning from the topdown and bottom-up. Data maintains its fixed value while splashing aggregated plan values to other cells. accurate, and more flexible. 

Puedes ver aquí nuestra presentación en español:


La ciudad de Chicago libera ETL Toolkit Open Source para Open Data

$
0
0

Que gran iniciativa la de la ciudad de Chicago que ha usado Kettle (Pentaho Data Integration) y ha liberado codigo para Open Data que está a disposición de todos

This toolkit provides several utilities and framework to help governments deploy automated ETLs using the open-source Pentaho data integration (Kettle) software.
Namely, this toolkit will allow:

  • Loading data from a database and upload it to a Socrata data portal
  • Integrates with an SMTP server to provide e-mail alerts on the outcome of ETL scripts to administrators
  • Handles deployment issues when using multiple operating systems during development
  • Utilities to allow administrators to quickly analyze the log files of ETLs for quick diagnostics
Para saber más sobre Open Data, Smart Cities y Open Source:


Google Earth Pro es ahora gratis

$
0
0

"Google Earth Pro, the premium version of Google's popular Google Earth service, is now free"

Esta es la frase mágica. Antes costaba unos 400 dolares al año. La versión Pro, comparada con Google Earth trae herramientas que facilitan la vida. 


Over the last 10 years, businesses, scientists and hobbyists from all over the world have been using Google Earth Profor everything from planning hikes to placing solar panels on rooftops. 
Google Earth Pro has all the easy-to-use features and detailed imagery of Google Earth, along with advanced tools that help you measure 3D buildings, print high-resolution images for presentations or reports, and record HD movies of your virtual flights around the world.

Startingtoday, even more people will be able to access Google Earth Pro: we're making it available for free. To see what Earth Pro can do for you—or tojust have fun flying around the world—grab a free key and downloadEarth Pro today. If you're an existing user, your key will continue to work with no changes required.

Open Source Business Intelligence tips and tricks in January

$
0
0


Now you can check latest tips on Business Intelligence Open Source, mainly Pentaho, Ctools and Saiku in January. You can see some of this tips implemented in stratebi demos. This month with great stuff:


-          http://flink.apache.org/


Peliculas convertidas en visualizaciones

$
0
0
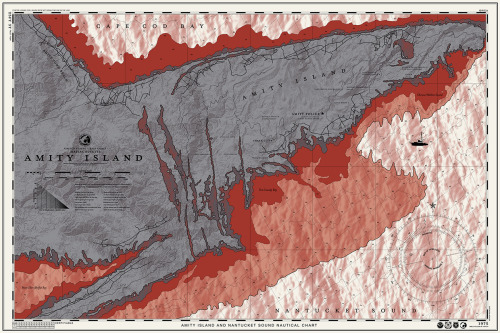
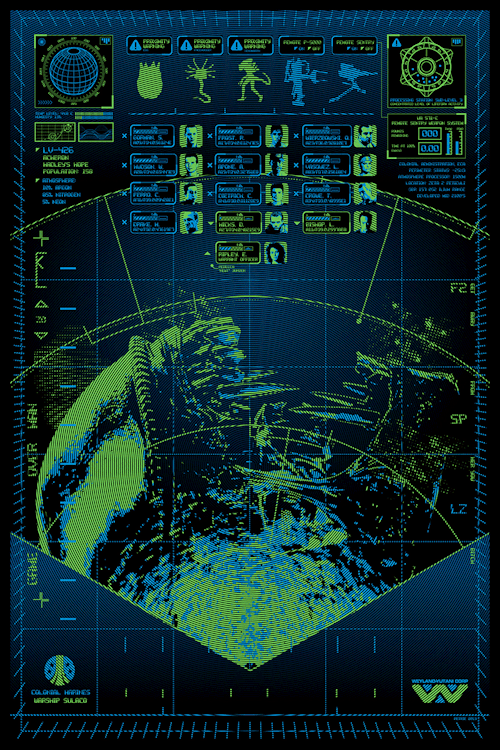
Nos gusta mucho esta iniciativa del artista Anthony Petrie, de convertir películas famosas en visualizaciones, mapas e infografías. Os dejamos unos ejemplos:

Star Wars


Wonka Chocolate


Parque Jurásico


Indiana Jones


Tiburón


El resplandor


Ghostbusters


Alien


La jungal de cristal


Perdidos


Consejos para presentar bien los datos

$
0
0

Interesante y útil la presentación de StephanieEvergreen.com, con ejemplos y consejos sobre visualización
StephanieEvergreen.com.#sthash.4suMLKwJ.dpuf
StephanieEvergreen.com. #sthash.4suMLKwJ.dpuf


Jedox Social Analytics

$
0
0

Una nueva funcionalidad de nuestras solución CPM preferida: Jedox Social Analytics

Social Data for Decision Makers with Jedox Business Intelligence

Use Jedox to go one step further and access the powerful Twitter database with our BI solution for Excel and the web. Jedox users may query, analyze, scale, and visualize specific data in the back-end. Optimize your sales through simulation and predictive analysis and benefit from the opportunities of Operational Intelligence.


Airbnb Map

100 mapas que no te puedes perder

Viewing all 866 articles
Browse latest View live