Quantcast
Channel: Business Intelligence y Big Data: ¡Aprende Gratis sobre Analytics!
Viewing all 866 articles
Browse latest View live

Por que el ETL es crucial

$
0
0
 

Por favor, leed este articulo. Es una joya para todos los que trabajan en Data Warehouse, Business Intelligence, Big Data


En TodoBI nos gusta decir que en los proyectos BI, DW son como un iceberg (la parte oculta es la mas grande e importante) y se corresponde con el ETL


Un extracto del artículo:


"ETL was born when numerous applications started to be used in the enterprise, roughly at the same time that ERP started being adopted at scale in the late 1980s and early 1990s"


Companies needed to combine the data from all of these applications into one repository (the data warehouse) through a process of Extraction, Transformation, and Loading. That’s the origin of ETL.


So, since these early days, ETL has essentially gotten out of control. It is not uncommon for a modest sized business to have a million lines of ETL code. 


ETL jobs can be written in a programming language like Java, in Oracle’s PL/SQL or Teradata’s SQL, using platforms like Informatica, Talend, Pentaho, RedPoint, Ab Initio or dozens of others.


With respect to mastery of ETL, there are two kinds of companies:


  • The ETL Masters, who have a well developed, documented, coherent approach to the ETL jobs they have
  • The ETL Prisoners who are scared of the huge piles of ETL code that is crucial to running the business but which everyone is terrified to change.
Mas info: ETL con soluciones Open Source

Hadoop Hive y Pentaho: Business Intelligence con Big Data (Caso Practico)

$
0
0


Cuando los profesionales del Business Intelligence (BI) oímos hablar de Big Data existe una cuestión que nos suele venir a la cabeza casi de forma natural ¿Es posible usar Big Data para el desarrollo de aplicaciones de BI típicas como el análisis OLAP o la generación de informes? 

A continuación, si la respuesta es afirmativa, con seguridad nos surgirán algunas dudas más:

  •   Posibilidades de conexión con las herramientas de BI. Por ejemplo con Pentaho, la suite BI Open Source más conocida y líder del mercado
  •   Rendimiento con aplicaciones de generación de informes y OLAP
  •   Carga de datos relacionales, procesos de ETL con Big Data, automatización de los procesos…

Para intentar dar respuesta a algunas de las cuestiones anteriores, hemos llevado a cabo un conjunto de pruebas para el desarrollo de aplicaciones BI haciendo uso del binomio Hadoop – Pentaho

La prueba ha consistido en replicar un Data Warehouse  generado en un proyecto real sobre una BBDD Oracle y con una alta volumetría, a un nuevo Data Warehouse en el clúster Hadoop usando la herramienta Apache Hive

Gracias a la conexión JDBC, conectaremos Hive con las aplicaciones disponibles en la suite Pentaho para evaluar la viabilidad de la generación de informes o reporting con Big Data, siendo esta una de las aplicaciones BI más demandadas en la actualidad por las empresas.
 
Para llevar a cabo la prueba hemos usado las últimas versiones 6.X de las herramientas de Pentaho y disponemos de un clúster Hadoop con las siguientes características:

·         Distribución 2.4 de Hortonworks
·         2 máquinas o hosts
·         2 procesadores por máquina (total 4)
·         16 Gb Ram por máquina (total 32 Gb)


Generación de informes

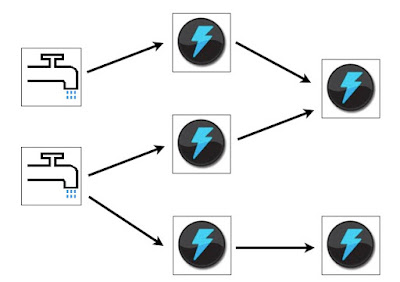
En la siguiente imagen puede verse la arquitectura de la aplicación BI desarrollada:


Para la carga de las tablas del DW de Oracle en Hadoop hemos usado tanto Sqoop como Pentaho Data Integration, gracias a la integración de esta última con HDFS y Sqoop. 

Tras esto, para la creación del Data Warehouse en Hadoop hemos usado la herramienta Apache Hive. Esta herramienta soporta consultas en lenguaje SQL y usa como almacenamiento el sistema de archivos distribuido de Hadoop HDFS. 
Además, recientemente se ha incorporado en la distribución Hortonworks el nuevo motor de ejecución Apache Tez, que mejora en gran medida el rendimiento de Hive haciendo uso intensivo de la memoria RAM del clúster y evitando el uso de IO a disco siempre que sea posible.

Por último, hemos usado la conexión JDBC disponible en Hive para conectar con las siguientes aplicaciones de la suite Pentaho, con el objetivo de dar soporte a la generación de informes sobre el Data Warehouse creado Hive:

 * Pentaho Reporting Designer: Usada para la generación de informes estáticos y parametrizables. Para las pruebas hemos creado 3 informes con consultas de distinta complejidad.

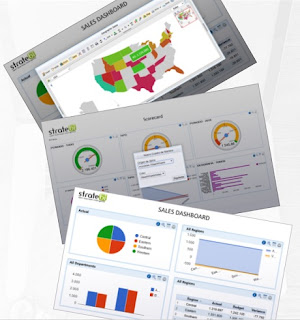
* Pentaho Metadata Editor: Creación de un modelo de metadatos que es usado por aplicaciones como STReport para la generación de informes AdHoc, herramienta incluida en la suite Lince BI, desarrollada por el equipo de StrateBI a partir de Saiku Reporting. Con STReport generaremos 3 informes con consultas similares a las de los 3 informes estáticos generados con Pentaho Reporting Designer.

* Pentaho BA Analytics (Servidor de BI): Servidor de BI de Pentaho, donde ejecutaremos los informes creados con Pentaho Reporting Designer y crearemos nuevos informes sobre el modelo de metadatos usando la herramienta STReport


Dado que los entornos Big Data están preparados para procesar volúmenes de datos mucho más grandes que los de nuestro DW de ejemplo, hemos creado dos tablas de hechos adicionales a la original de 1.240.361 filas, las cuales tienen 5.161.444 filas (x4) y 25.807.220 (x20) respectivamente. De esta forma hemos creado versiones de los 6 informes (3 estáticos con PRD y 3 adhoc con PME + STReport) que se ejecutan sobre las 3 tablas de hechos de distinta volumétrica. 

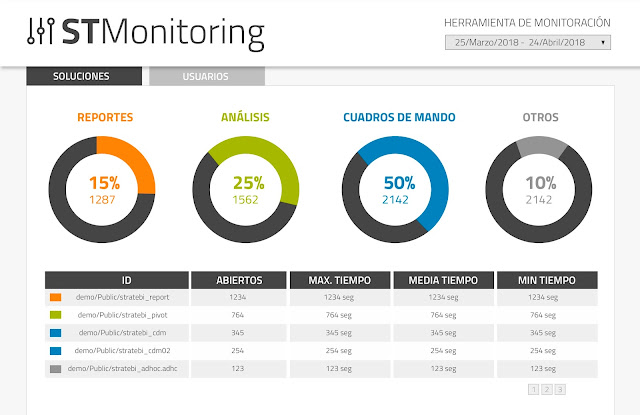
Tras la ejecución, en la siguiente tabla se muestran los tiempos de generación medidos:


Conclusiones

Esta prueba nos demuestra que es posible la generación de informes sobre datos que están almacenados en una plataforma Big Data como Apache Hadoop, gracias a las capacidades de la herramienta Apache Hive y su conectividad JDBC. 

También hemos comprobado como las herramientas de la suite Pentaho, gracias a su conectividad con Hadoop, son el complemento ideal para el desarrollo de aplicaciones BI que hacen uso del Big Data
No obstante es necesario tener en cuenta los tiempos de respuesta en la generación de informes, los cuales hacen que la generación de informes sobre Hive sea recomendada en casos los que el tiempo respuesta instantánea no sea un requisito indispensable. A cambio, obtenemos la posibilidad de generar informes sobre datos de tipo Big Data (Volumen, Variedad y Velocidad). 

En cualquier caso, nuestro clúster de pruebas tiene unas prestaciones muy reducidas, siendo habitual el despliegue de clúster que cuentan con más 5 máquinas y un cantidad de memoria RAM en conjunto superior a los 100 Gb. Es precisamente el uso intensivo de la RAM por Apache Hive (sobre el motor de ejecución Tez), lo que seguramente está penalizando nuestros tiempos en respuesta en más de 10-15 segundos.

Dado que existen más herramientas y aplicaciones BI susceptibles de ser desarrollados con la tecnología Big Data, en pruebas posteriores nos proponemos comprobar las capacidades de Apache Impala para la generación de informes en una distribución de Cloudera o el análisis OLAP usando el novedoso Kylin sobre Hadoop

Esperamos que os sea útil


·  


Ranking de las mejores Bases de Datos

$
0
0
Mas de 300 bases de datos son evaluadas en la comparativa que realizan en DB-engines anualmente

Un imprescindible para todos los que manejan datos. Cada vez tenemos más opciones y tecnologías donde elegir. Ah, y la mayoría, son Open Source


Checklist para hacer un proyecto Business Intelligence

$
0
0
Analisis

BI Termometer, es la iniciativa que tenemos en marcha, para hacer una gran recopilación de los indicadores más importantes a la hora de poner en marcha un proyecto Business Intelligence. Muchos proyectos Business Intelligence fracasan por no haber realizado una correcta toma de requerimientos. Desde Stratebi queremos ayudar a solventar este problema.

El objetivo es llegar a los 1500 indicadores de relevancia para construir este tipo de sistemas. Además, nos hemos propuesto ofrecer esta herramienta en abierto de forma que pueda ser de utilidad para todos, ofrecíéndola de forma online y generando informes y cuadros de Mando de resumen.Totalmente gratis!!

Aquí tenéis toda la información.

Ya están disponibles dos nuevas áreas de análisis (con gran cantidad de indicadores), que se añaden a la anteriores ya disponibles, por lo que ya tenemos:
- Analisis
- Reporting y User Interface
- Business Rules.
- ETL y Calidad de Datos.

- DW (Nuevo)

- Arquitectura (Nuevo)

Dashboard

Esperamos que esta herramienta os sea de ayuda!! no dudéis en darnos feedback de vuestra utilización.

Real Time Analytics, concepts and tools

$
0
0

We could consider three types of Real Time when we manage data and depends on each stage:

1. Real Time Processing: Is the possibility of ingest data at the time the event is produced in real live. This includes only processing step, i.e copying data from source to destiny and guarantees data to be ready for analytics

You can try some online demos here


Technologies:


2. Stream Analytics: it performs analytics of data on the fly, as a stream is usually analyzed in a window time frame, the analytics we can do here is limited because only attack a very limited data set


Technologies:


3. Real Time Analytics: refers to two basic conditions: the most recent data will be included in any report, graphic, etc, that analytics will take near to 0 time in execute


Technologies:


In Memory Mapreduce
-Apache Spark (Spark SQL)

Column Storage Engines
-Kafka + (Spark | Flink) + 
-InfluxDB (Time series analytics)


-Marketing (Product recommendations based on latest updates)
-Fraud Detection (Tracking suspect activities on events that appear to be fraudulent)
-Health Care Monitoring (Social network trending topics can help to this)


Big Data: Real Time Dashboards with Spark Streaming

$
0
0


Al abrirse la página de esta demostración, se solicita una conexión con el end point que provee los datos de la wikipedia, mediante un WebSocket.


Enel servidor se crea una conexión con el cliente y mientras esté abierta y no ocurran errores en el envio, el sistema busca los datos de los componentes de "Broadcast Queue". Estos componentes, a su vez, están recibiendo datos del API REST, que les llega a través del Cliente Http implementado y usado por Spark para enviar los resultados.
La implementación de la "Broadcast Queue", permite que todas las conexiones al servidor puedan buscar los datos en la misma cola obteniendo un tiempo óptimo de O(1), (Complejidad Computacionalde obtener datos de una Cola de Mensajes) para cada conexión en recibir el mensaje.


A su vez, en su papel de Cola de Mensajes permite que la comunicación entre Spark y el Server Socket sea óptima, en O(1) igualmente sin contar los retrazos por red.


Esta implementación permite que un número muy alto de clientes puedan conectarse a visualizar en tiempo real los datos recibidos de la wikipedia.

Puedes ver también un video en funcionamiento:

Diferencias entre Data Analyst, desarrollador Business Intelligence, Data Scientist y Data Engineer

$
0
0


Conforme se extiende el uso de analytics en las organizaciones cuesta más diferenciar los roles de cada una de las personas que intervienen. A continuación, os incluimos una descripción bastante ajustada

Data Analyst

Data Analysts are experienced data professionals in their organization who can query and process data, provide reports, summarize and visualize data. They have a strong understanding of how to leverage existing tools and methods to solve a problem, and help people from across the company understand specific queries with ad-hoc reports and charts.
However, they are not expected to deal with analyzing big data, nor are they typically expected to have the mathematical or research background to develop new algorithms for specific problems.

Skills and Tools: Data Analysts need to have a baseline understanding of some core skills: statistics, data munging, data visualization, exploratory data analysis, Microsoft Excel, SPSS, SPSS Modeler, SAS, SAS Miner, SQL, Microsoft Access, Tableau, SSAS.


Business Intelligence Developers

Business Intelligence Developers are data experts that interact more closely with internal stakeholders to understand the reporting needs, and then to collect requirements, design, and build BI and reporting solutions for the company. They have to design, develop and support new and existing data warehouses, ETL packages, cubes, dashboards and analytical reports.
Additionally, they work with databases, both relational and multidimensional, and should have great SQL development skills to integrate data from different resources. They use all of these skills to meet the enterprise-wide self-service needs. BI Developers are typically not expected to perform data analyses.

Skills and tools: ETL, developing reports, OLAP, cubes, web intelligence, business objects design, Tableau, dashboard tools, SQL, SSAS, SSIS.


Data Engineer

Data Engineers are the data professionals who prepare the “big data” infrastructure to be analyzed by Data Scientists. They are software engineers who design, build, integrate data from various resources, and manage big data. Then, they write complex queries on that, make sure it is easily accessible, works smoothly, and their goal is optimizing the performance of their company’s big data ecosystem.
They might also run some ETL (Extract, Transform and Load) on top of big datasets and create big data warehouses that can be used for reporting or analysis by data scientists. Beyond that, because Data Engineers focus more on the design and architecture, they are typically not expected to know any machine learning or analytics for big data.

Skills and tools: Hadoop, MapReduce, Hive, Pig, MySQL, MongoDB, Cassandra, Data streaming, NoSQL, SQL, programming.


Data Scientist

A data scientist is the alchemist of the 21st century: someone who can turn raw data into purified insights. Data scientists apply statistics, machine learning and analytic approaches to solve critical business problems. Their primary function is to help organizations turn their volumes of big data into valuable and actionable insights.
Indeed, data science is not necessarily a new field per se, but it can be considered as an advanced level of data analysis that is driven and automated by machine learning and computer science. In another word, in comparison with ‘data analysts’, in addition to data analytical skills, Data Scientists are expected to have strong programming skills, an ability to design new algorithms, handle big data, with some expertise in the domain knowledge.

Moreover, Data Scientists are also expected to interpret and eloquently deliver the results of their findings, by visualization techniques, building data science apps, or narrating interesting stories about the solutions to their data (business) problems.

The problem-solving skills of a data scientist requires an understanding of traditional and new data analysis methods to build statistical models or discover patterns in data. For example, creating a recommendation engine, predicting the stock market, diagnosing patients based on their similarity, or finding the patterns of fraudulent transactions.
Data Scientists may sometimes be presented with big data without a particular business problem in mind. In this case, the curious Data Scientist is expected to explore the data, come up with the right questions, and provide interesting findings! This is tricky because, in order to analyze the data, a strong Data Scientists should have a very broad knowledge of different techniques in machine learning, data mining, statistics and big data infrastructures.

They should have experience working with different datasets of different sizes and shapes, and be able to run his algorithms on large size data effectively and efficiently, which typically means staying up-to-date with all the latest cutting-edge technologies. This is why it is essential to know computer science fundamentals and programming, including experience with languages and database (big/small) technologies.


Skills and tools: Python, R, Scala, Apache Spark, Hadoop, data mining tools and algorithms, machine learning, statistics.


Visto en BigDataUniversity

Analisis de los Panama Papers con Neo4J - Big Data

$
0
0


En este ejemplo se usa Neo4j como Base de Datos basada en grafo para modelar las relaciones entre las entidades que forman parte de los Papeles de Panamá (PP). A partir de ficheros de texto con los datos y relaciones entre clientes, oficinas y empresas que forman parte de los PP, hemos creado este grafo que facilia la comprensión de las interacciones entre sujetos distintos en esta red.
La demostración comienza seleccionando una entidad de cualquier tipo (Address, Company, Client, Officer), según el tipo que seleccione se muestran los atributos de ese nodo, luego seleccione el atributos que desea e introduzca el filtro, agregando varios paneles para filtrar por más de uno si es necesario. El parámetro "Deep" significa el número de conexiones al elemento seleccionado que se quiere mostrar.
En el servidor se hace una búsqueda BFS a partir del nodo seleccionado realizando consultas a Neo4j para cada tipo de relación donde una de sus partes sea el nodo actual, hasta llegar al nivel de profundidad solicitado. Se van guardando los nodos y los arcos para devolverlos como resultado.


Para la visualización del grafo se ha usado Linkurious, uno de los componentes más efectivos para este propósito en el mercado. Se puede interactuar con el grafo haciendo zoom, seleccionando elementos, moviendo elementos o usando el lasso tool para seleccionar varios nodos. Haciendo doble click sobre un nodo se cargan las conexiones a él que no estén visualizadas.
Neo4j y las Bases de Datos basadas en grafos en general tienen aplicaciones muy particulares, como Detección de Fraudes (descubriendo patrones de relaciones entre nodos), Recomendaciones en Tiempo Real (es relativamente sencillo, usando el peso de las relaciones de cada nodo, su tendencia, etc), Analítica de Redes Sociales (por la facilidad de implementar algoritmos de grafos en este tipo de Base de Datos)
Enjoy it!!


List of Open Source solutions for Smart Cities - Internet of Things projects

$
0
0

Increasingly projects are carried on so-called 'Smart Cities', supported by Big Data, Internet of Things... and the good news is that most of them are made with Open Source technologies. We can share, from TodoBI.com our insights about these technologies

Making a city “smart” involves a set of areas we will outline below: Without IOT (Internet Of Things), there will be no Smart City. 

Since automatic collected data is the most efficient way to get huge amounts of information, devices connected to the internet are an essential part of a Smart City.
The way we store and process data from city is generally using Big Data and Real Time Streaming technologies. 

The final goal where more innovative and custom analysis can be achieved using Artificial Intelligence and Machine Learning. Finally I would include Apps, as usually this kind of solutions is consumed in mobile devices. 


Here we outline the common process of building a Smart City solution: 

-Choose data 
-Connecting devices 
-Design Data Storage Infrastructure 
-Real Time Events and Notifications 
-Analytics -Visualization (Dashboards) 

 1) Choosing Data 

In a city there are three basic sources of data: citizens, systems, sensors. Use the available information of users, on social networks, informations systems, public statistical information offered by the administration. 

A typical example is user with geolocalization enabled in twitter. Information about the systems and services in a city are sometimes available in open data sources. An example could be the water or electricity consumption. 

Last but not least, sensors. A city hoping to become “Smart” has to intend to provide automatic information of its environment, and that could be achieved using sensors. Sensors can be anywhere


2) Connecting Devices


Devices (sensors) connects with the real time data streaming and the storage infrastructure using efficient communications protocols, that using light weight packaging and asynchronous communications.


Examples of some communications protocols used:


MQTT (Message Queuing Telemetry Transport) Websocket (bi-directional web communication and connection management)


STOMP (The Simple Text Oriented Messaging Protocol)


XMPP (Extensible Messaging and Presence Protocol)


3) Design Data Storage Infraestructure 


The Data Storage Infrastructure for a Smart City solutions has special characteristics, due to the diversity and dynamism of its sources. 


Time series DB are frequently used, because of the time evolution of data catched by sensors Some examples of this kind of DB are InfluxDB and Druid

Another DB commonly used in Smart Cities project are MongoDB (json format advantages), Cassandra (fast insertion advantages), Hadoop (big data frameworks advantages)

Some samples


4) Real Time events and notifications


Usually Smart Cities solutions have needs for real time notifications on events. To accomplish such requirements the system must have a Stream Analytic engine, that can react to events in real time and send notification. This characteristics bring us some technologies related to this; Storm, Spark Streaming, Flink, WebSocket, Socket.IO


IoT Frameworks:


Node-RED


Node-RED is a tool for wiring together hardware devices, APIs and online services in new and interesting ways.

The light-weight runtime is built on Node.js, taking full advantage of its event-driven, non-blocking model. This makes it ideal to run at the edge of the network on low-cost hardware such as the Raspberry Pi as well as in the cloud.

The flows created in Node-RED are stored using JSON which can be easily imported and exported for sharing with others.
An online flow library allows you to share your best flows with the world


PubNub


     PubNub is a Data Stream Network, that offers infrastructure as a service. With PubNub,  we can use the infrastructure provided and connect our devices, designing our architecture and simply get advantages of all this.

PubNub has 5 main tools:

-Publish Subscribe (Allows Real Time Notifications of Events to users)
-Stream Controller (Allows managing channels and groups of channels)
-Presence (Allows notifications when users login or leave the system, or similar behaviour, device availability for example)
-Access Manager (Allows administrators, to grant or deny permitson users of the systems)
-Storage & Playback (Provide storage for messages,and allows messages retrieval at later time)


IoT-AWS


AWS IoT is a platform that enables you to connect devices to AWS Services and other devices, secure data and interactions, process and act upon device data, and enable applications to interact with devices even when they are offline


5) Analytics and Visualization


You can show real time dashboards, reports, OLAP Analysis using tools like Pentaho. See samples of Analytics  

Integracion Talend-Salesforce (Paper)

$
0
0


El propósito de este documento es realizar un pequeño ejercicio entre la herramienta Talend Open Studio (v7.1) y Salesforce

Descargar

Salesforce es un servicio en nube (cloud service) y como tal, trae nuevos conflictos y retos. A diferencia de las bases de datos relacionales la mayoría de características no están disponibles en el servicio cloud y es necesario una herramienta adicional de integración para el consumo de datos. 

Salesforce dispone de cuatro ediciones principales: Salesforce Essentials, Lightning Professional, Lightning Enterprise y Lightning Unlimited. La posibilidad de comunicación vía API es a partir de la versión Lightning Enterprise

Te puede interesar:

Caso Practico: trabajando con APIs y Talend

Como integrar Salesforce y PowerBI


Os contamos las posibilidades de integración de las dos soluciones Business Intelligence y CRM más extendidas del mercado: PowerBI y Salesforce Gracias a la posibilidad de integración de las herramientas se abre una gran cantidad de posibilidades Ahora puede obtener información en tiempo real de los datos de Salesforce mediante la conexión a través de Power BI Según los principales estudios, tanto Salesforce como Microsoft PowerBI lideran...


Descarga el paper con tips para Talend


Os damos acceso a un interesante paper de nuestros compañeros de Stratebi, Partners de Talend (la potente solución ETL open source, con versión también Enterprise), que aborda los temas de la integración con Google Big Query, como realizar cargas incrementales y debugging Descargar paper Mas info: Caso Practico: trabajando con APIs y Talend agosto 29, 2018  destacado, Documentacion, ETL, Talend  No...


Tips y Tecnicas de optimización de Vertica con Talend


Os traemos unos cuantos trucos y recomendaciones sobre dos de nuestras herramientas favoritas: Vertica y Talend Configuring Talend for Use with Vertica To configure Talend for use with Vertica, you must understand: Using Talend Components for Vertica Using the Talend SQL Builder Enabling Parallelization in Talend ...


Comparacion entre Talend y Pentaho


Hace un tiempo os poníamos una primera Comparación entre Pentaho Data Integration Talend Open Studio. Hoy traemos otra comparación interesante: Talend: Talend is an open-source data integration tool whereas Pentaho Kettle is a commercial open-source data integration tool Talend offers limited connectivity to concurrent databases, and other forms of data but has a dependency factor of Java drivers to connect to the data sources...


Caso de uso de Apache Kafka en tiempo real, Big Data

$
0
0

Este es un buen ejemplo de uso de Apache Kafka en entornos Big Data para consultas y visualización. Ver Cuadro de Mando

En la imagen inferior se muestra el cluster de brokers 3 producers que emiten datos hacia el cluster kafka.


El componente "Kafka Producer" se conecta al stream de la wikipedia y registra un listener, que es un sujeto del patrónobserver ; cuando se genera una actualización en la wikipedia se recibe a través del "Socket" y este lo notifica al "Listener", que contiene un org.apache.clients.producer.KafkaProducer, el producer registra un callback para notificarle que se ha enviado un mensaje a kafka, la notificación contiene el offset y lapartición de cada mensaje, en este paso se envía cada minuto vía API el tiempo en milisegundos y el offset para ese tiempo.


Esta información se almacena en una Base de Datos PostgreSQL, para luego ser consultada. Cuando el usuario selecciona una fecha a partir de la cual quieren ver los mensajes, el sistema busca en la Base de Datos un offsetregistrado en la fecha solicitada, el cluster kafka mantiene los mensajes en los ficheros locales por 3 días.
Una vez obtenido el offset para la fecha requerida se solicita por medio del "Consumer Holder" un "Thread Safe Kafka Consumer" que realiza las operaciones seek y poll, para indicar el punto y consumir a partir de él respectivamente.
Pordefecto,un org.apache.kafka.clients.consumer.KafkaConsumer no es Thread Safe, por tanto para ser usado en un entorno con accesos simultáneo de usuarios se hizo una implementaciónque permite usar un Consumer por varios hilossinchronizando el acceso al objeto.

STAgile (easy and fast web Dashboards from excel), open source based

$
0
0


STAgile is a quick and simple dashboard generator that gives the user the ability to create their own dashboards using Excel and CSV files including save, share, filter, export features...

What does STAgile offer?


  •     Simple design for intuitive operation
  •     You don't have to write a single line of code
  •     Generation of charts from Excel or CSV
  •     Navigate through hierarchies using drill down
  •     Synchronized Graphics
  •     Simple and user-friendly configuration system
  •     Export to CSV
  •     Table mode. View all your dashboard data
  •     Save and share your Dashboard
  •     Pentaho and web portals integration

You can see on this series of VideoTutorials, the main features of STAgile (best open source based web dashboarding tool from Excel, with no licenses and professional support included) and how it works

STAgile is part of LinceBI Open Analytics solution


0. From Excel to Dashboards for end users
1. STAgile Basic example import csv file, basic graphs, dashboard view, export to csv
2. STAgile Advanced example I. geo choropleth, numbers graph
3. STAgile Advanced example I. Heat map, drill and filters with advanced graphs
4. STAgile Advanced I. Line graphs, edit cvs and export data
5. STAgile Advanced II. Scatter plot, Box plot, Bubble graph
6. STAgile Advanced III. custom text, images and links
7. STAgile Advanced IV. custom iFrames


Know more:


STDashboard (Web Dashboard Editor open source based), Video Tutorials


You can see on this series of VideoTutorials, the main features of STDashboard (best open source based web dashboarding tool, with no licenses and professional support included) and how it works STDashboard is part of LinceBI Open Analytics solution 0. STDashboard (Dashboard for end users in minutes) 1. STDashboard (LinceBI Open Source BI/BigData Solution) 2. STDashboard (LinceBI Vertical Dashboarding Solution) 3. STDashboard...


STPivot (Web Analytics open source based) complete Videotutorials


You can see on this series of VideoTutorials, the main features of STPivot (best open source based web analysis tool, with no licenses and professional support included) and how it works Besides, you can embed, customize and modify in order to fit your needs STPivot is part of LinceBI Open Analytics solution 1. LinceBI OLAP interactive analysis 2. STPivot OLAP Analytics for Big Data  3. Powerful Forecasts in STPivot 4. STPivot...


Introducing STMonitoring for Pentaho


One of the things more useful when you are running a Pentaho production environment with a lot of users accessing the BI server, using reports, dashbords, olap analysis... is monitor the whole user performance.                             That´s why we´ve created STMonitoring (included free in all of the projects we help to develop and in some solutions, like LinceBI)....


STReport (Web Reporting Open Source based tool) Video Tutorials


You can see on this series of VideoTutorials, main features of STReport (best open source web reporting tool based, with no licenses and professional support included) and how it works STReport is part of LinceBI Open Analytics solution 1. STReport (creating simple report using rows, groups, filters) 2. STReport (Models, exploring categories and glossary) 3. STReport (Work area, hidden sections, limit results, info options...) 4. STReport...


List of Open Source Business Intelligence tools


Here you can find an updated list of main business intelligence open source tools. If you know any other, don´t hesitate to write us - Talend, including ETL, Data quality and MDM. Versions OS y Enterprise - Pentaho, including Kettle, Mondrian, JFreeReport and Weka. Versions OS y Enterprise - BIRT, for reporting - Seal Report, for reporting - LinceBI, including Kettle, Mondrian, STDashboard, STCard and STPivot - Jasper Reports, including...


STDashboard, a free license way to create Dashboards


The improvements in this version of STDashboard are focused on user interface for panel and dashboard and also some enhancement in performance and close some old bugs. It works with Pentaho and embeded in web applications You can see it in action in this Pentaho Demo Online and as a part of LinceBI suite STDashboard doesn´t requiere anual license, you can manage unlimited users and it´s open source based.  STDashboard includes professional...

Comparacion de Tableau y Pentaho

$
0
0

Muchas veces publicamos estudios y comparativas de diferentes tecnologías Business Intelligence o Big Data. Pero como suele ocurrir en muchos aspectos, lo mejor es verlos en funcionamiento sobre la práctica. 

Por ello, os mostramos ejemplos de Cuadros de Mando creados con Tableau y Pentaho con los datos de la Liga de Futbol en España para poder comparar

Pinchad en cada uno de los cuadros de mando para acceder a los mismos:

Tableau:


Pentaho (también puedes ver otra DemoPentaho Online)


Comparativa Herramientas Business Intelligence


Migracion y update de versiones de Pentaho

$
0
0

Pentaho CE lleva más de 10 años siendo implementado en muchas organizaciones. 

Afortunadamente, en la mayor parte de los casos, los usuarios le sacan un gran partido, pero conforme han ido saliendo nuevas versiones y se han ido produciendo mejoras por la comunidad, se suele hacer necesario un upgrade para mejorar:

- Rendimiento y cuellos de botella
- Mejorar el front-end y la experiencia de usuario
- Incluir nuevas funcionalidades y mejoras

Podéis echar un vistazo a las mejoras que introducen los especialistas en Pentaho de Stratebi, que incluyen:

- Mejoras en la consola (tags, search, comentarios)
- Herramientas OLAP y Reporting mejoradas
- Nuevas herramientas de generación de Dashboards y Scorecards
- Potentes Cuadros de Mando predefinidos
- Integración con entornos Big Data y Real Time

Ver las mejoras en acción:

Demo_Pentaho - Big Data


Aplicaciones de Big Data en Turismo


Cuadros de Mando y Business Intelligence para Ciudades Inteligentes

$
0
0

Cada vez son más las ciudades que están implementando soluciones de Ciudades Inteligentes, Smart Cities... en donde se abarcan una gran cantidad de aspectos, en cuando a tecnologías, dispositivos, analítica de datos, etc...

Lo principal en todos ellos es que son soluciones que deben integrar información e indicadores diversos de todo tipo de fuentes de datos: bases de datos relacionales tradicionales, redes sociales, aplicaciones móviles, sensores... en donde es fundamental que no haya islas o tecnologías cerradas, por lo que el Open Source es fundamental, pues se puede adaptar a todo tipo de soluciones

En base a nuestra experiencia en algunos de estos proyectos de ciudades inteligentes en los que hemos participado, queremos compartir unos cuantas tecnologías, recursos y demos que os pueden ser de ayuda:

1. List of Open Source solutions for Smart Cities - Internet of Things projects

2. List of Open Source Business Intelligence tool for Smart Cities 

3. 35 Open Source Tools para Internet of Things (IoT)


Demos:

Tecnologías Big Data

Demos Business Intelligence


Seguimiento del tráfico near real time en el Ayuntamiento de Madrid (Acceso)


Geoposicionamiento de rutas dinámicas (Acceso/Video)


Recomendación de Rutas (grafos) (Acceso/Video)


STCard Videotutorials (Open Source based Scorecard solution)

$
0
0


The improvements in this version of STCard, an open source based solution, are focused on user interface for panel and dashboard and also some enhancement in performance and close some old bugs:

- Import with ETL
- New KPIs always in red bug
- Tooltips and characters solved
- Export to PDF
- Modify colors of new scorecard
- Some other minus bugs...

It works with Pentaho and embeded in web applications

You can manage your organization with a powerful KPIs control with Balance Scorecard using STCard

You can see it in action in this Demo Online and as a part of LinceBI suite

STCard doesn´t requiere anual license, you can manage unlimited users and it´s open source based. 

Videotutorials:

- STCard 01 Global View
STCard 02 Create a new scorecard and security
STCard 03 Configuration
STCard 04 Planning and write back data
STCard 05 Scorecard Analysis and dashboard

STCard includes professional services (training, support and maintenance, docs and bug resolution - so, you have high enterprise level guaranteed -)

Interested? contact Stratebi or LinceBI


See a Video Demo:


About main functionalities:

STCard works on top of Pentaho, is the best tool for managing your KPIs (Key Performance Indicators), targets an keep track of your Balance Scorecard strategy


Fully integrated with Pentaho CE, you can leverage all the power of this Open Source BI Suite


STCard is an open source tool developed by StrateBI for the creation, management and analysis of Scorecards.
A Scorecard is a global management system within an organization that allows you to have a view of it based on a number of perspectives. All these as a whole define the vision and strategy of the organization.
To define a Scorecard you have to define a clear strategy:
  • Strategic Objectives for the units of the organization.
  • Indicators (KPI’s) that mark the fulfillment of the strategic objectives.
The main features of STCard are:
  • Flexibility: A Scorecard is always referred to an organization as a whole, but with STCard we can create a scorecard for a specific area of the organization. For example:Treasury Financial Area, Consolidation, Suppliers, etc. On the other hand, the concept of flexibility is applicable to the creation of a scorecard in terms of the number of strategic perspectives and objectives. As many as you like. The philosophy of Kaplan and Norton is not limited to 4 perspectives: customer, financial, internal business procedures and learning and growth. You can create as you need
  • Flexibility does not break with the original philosophy. A scorecard in STCAD consists of a weighted hierarchical structure of 3 levels:
    • Perspective: from what point of view we will see our system. For example, financial, quality, customers, IT, etc.
    • Strategic Objective: what is our goal. For example, increase profitability, customer loyalty, incentive and motivation HR, etc.
    • Indicator (KPI): the measure or metric. Indicators can be quantitative or qualitative (confirmation / domain values), and these always have a real value and a target value.
For the launch of the ScoreCard we can consider three scenarios:
  • This scenario has a rapid implementation, and only requires the definition of a load processes to obtain the information of the indicators of the organization and adapt it to STCard.
  • The organization lacks a system / repository of indicators.
    This variant requires more consulting work, because in the organization, first, a pure BI project must be carried out to obtain those indicators to be dealt with later in STCARD.
    For example: data sources; ETL processes; System / repository of indicators; Load processes in STCard.
  • Immediate start-up:
    It is the fastest alternative, only requires installation / configuration and training. Data management is done through Excel templates. No additional consulting work required.
    Users set values through Excel templates, where data is filled. These values are loaded into STCARD and after this, it is the users who interact with STCARD.

These are the main features of STCard:


More info:


STReport (Web Reporting Open Source based tool) Video Tutorials


You can see on this series of VideoTutorials, main features of STReport (best open source web reporting tool based, with no licenses and professional support included) and how it works STReport is part of LinceBI Open Analytics solution 1. STReport (creating simple report using rows, groups, filters) 2. STReport (Models, exploring categories and glossary) 3. STReport (Work area, hidden sections, limit results, info options...) 4. STReport...

STAgile Videotutorials (easy and fast web Dashboards from excel), open source based


STAgile is a quick and simple dashboard generator that gives the user the ability to create their own dashboards using Excel and CSV files including save, share, filter, export features... What does STAgile offer?     Simple design for intuitive operation     You don't have to write a single line of code     Generation of charts from Excel or CSV     Navigate through hierarchies using drill down  ...


STPivot (Web Analytics open source based) complete Videotutorials


You can see on this series of VideoTutorials, the main features of STPivot (best open source based web analysis tool, with no licenses and professional support included) and how it works Besides, you can embed, customize and modify in order to fit your needs STPivot is part of LinceBI Open Analytics solution 1. LinceBI OLAP interactive analysis 2. STPivot OLAP Analytics for Big Data  3. Powerful Forecasts in STPivot 4. STPivot...


STDashboard (Web Dashboard Editor open source based), Video Tutorials


You can see on this series of VideoTutorials, the main features of STDashboard (best open source based web dashboarding tool, with no licenses and professional support included) and how it works STDashboard is part of LinceBI Open Analytics solution 0. STDashboard (Dashboard for end users in minutes) 1. STDashboard (LinceBI Open Source BI/BigData Solution) 2. STDashboard (LinceBI Vertical Dashboarding Solution) 3. STDashboard...

7 Ejemplos y Aplicaciones practicas de Big Data

$
0
0

En las siguientes Aplicaciones, Cuadros de Mando y ejemplos podéis ver el funcionamiento práctico del Big Data en diferentes casos y usando diferentes tecnologías: Kafka, Spark, Apache Kylin, Neo4J....

Acceder a los ejemplos

Si quieres saber más de Big Data, te pueden interesar estos enlaces:

OLAP for Big Data. It´s possible? 
Como empezar a aprender Big Data en 2 horas
List of Open Source Business Intelligence tools
Analysis Big Data OLAP sobre Hadoop con Apache Kylin (spanish)
Caso de uso de Apache Kafka en tiempo real, Big Data
 (spanish)


Tutorial y Demo: trabajando con Grafana

$
0
0

Ya tenemos demo Grafana con datos públicos de ocupación del Ayuntamiento de Málaga recogidos mediante API. 


El propósito de este documento es recoger el proceso de creación de un cuadro de mandos que monitorice la situación de los parkings públicos de Málaga en tiempo real utilizando la herramienta Grafana.

Grafana es una herramienta de software libre que permite crear cuadros de mando y gráficas a partir de múltiples fuentes de datos. Suele ser utilizado para la visualización y monitorización de datos en tiempo real. 


En este ejemplo práctico el origen de datos será el portal de datos abiertos del Ayuntamiento de Málaga (https://datosabiertos.malaga.eu/), concretamente el conjunto de datos sobre la ocupación de los aparcamientos públicos municipales. Esta información se encuentra en formato CSV y se actualiza cada minuto.


Acceso Demo:

https://grafana.demo.stratebi.com
Usuario: demo
Pass: tKPnruDeN4YJWiTa


Tipos de roles en Analytics (Business Intelligence, Big Data)

$
0
0


Conforme va creciendo la industria de Analytics, se hace más dificil conocer las descripción de cada uno de los roles y puestos. Es más, generalmente se usan de forma equivocada, mezclando tareas, descripciones de cometidos, etc...

Esto lleva a confusión tanto a los propios especialistas, como a las personas que están formandose y estudiando para realizar estos trabajos. En una industria tan cambiante es frecuente la aparición y especialización de diferentes puestos de trabajos. Aquí, os detallamos cada uno de ellos:


Business Analyst:


Data Analyst:


Data and Analytics Manager:


Data Architect:


Data Engineer:


Data Scientist:


Database Administrator:


Statistician:


Te puede interesar tambien:

Como pasar una entrevista con Pentaho BI Open Source?
Skills en Data Analysts y sus diferencias
Empezar a aprender Big Data en 2 horas?

Visto en Kdnuggets
Viewing all 866 articles
Browse latest View live