Quantcast
Channel: Business Intelligence y Big Data: ¡Aprende Gratis sobre Analytics!
Viewing all 866 articles
Browse latest View live

Por qué si tengo un dashboard no soy capaz de tomar decisiones?

$
0
0


Muy interesante esta reflexión de Tristan Elosegui, de hace ya un par de años, pero que mantiene toda su vigencia. Abajo os indicamos los puntos principales que detalla:

En TodoBI, hablamos mucho de Dashboards (ver posts), de los que os destacamos:

12 aplicaciones gratuitas para crear Dashboards
Tutorial de Creación de Cuadros de Mando Open Source
Ejemplos Dashboards
- Cuadro de Mando Integral (Scorecard)

Según Tristán, las empresas tienen gran cantidad de datos a su alcance, pero no son capaces de poner orden entre tanto caos y como consecuencia, no tienen una visión clara de la situación. 

El ruido es mayor que la ‘señal’

El volumen de datos y la velocidad con la que se generan, provocan más ruido que señal.
Esta situación lleva a las empresas a la toma de decisiones sin los datos necesarios o a la parálisis post-análisis en lugar de facilitar la acción (toma de decisiones).
Los datos llegan desde diferentes fuentes, en diferentes formatos, desde diferentes herramientas,… y todos acaban en informes, que intentan integrar en un dashboard que les ayude a tomar decisiones.

¿Por qué teniendo tantos datos las empresas no son capaces de tomar decisiones estratégicas?

Tener muchos datos no siempre significa tener mejor visión sobre la situación. Seguro que más de uno de los que estáis leyendo este post, os sentís identificados.
Las empresas toman decisiones en base a datos todos los días (y sin datos también), el problema es que estas decisiones son tácticas ya que se toman tipo ‘silo’ (por áreas).
Para poder tomar decisiones que optimicen la estrategia global de la empresa necesitamos:
  • Tener los datos necesarios, ni más ni menos, para tomarlas (la foto más completa posible del contexto) y
  • ser capaces de entender los datos,para transformarlos eninformación y a continuación en conocimiento.
No hay nada peor que haber recorrido el camino hasta tener un dashboard estratégico, y que la persona que tiene que tomar las decisiones no las tome. ¿por qué ocurre esto?

Falta de contexto

El motivo principal para no tomar decisiones, es que los datos representados en el dashboard no sean relevantes, no sean accionables.
Esto ocurre cuando no hemos definido correctamente el dashboard (los pasos correctos están definidos en el modelo de madurez de la analítica digital). Los errores más comunes suelen ser:
  • Objetivos y KPIs mal definidos: si el punto de partida esta mal definido, todo lo que venga detrás nos llevará a error. Y por supuesto, el contexto será del todo equivocado.
  • Datos irrelevantes o no accionables: bien por una mala definición de objetivos y de las KPIs que nos ayudan a controlarlos o simplemente porque hemos seleccionado mal los datos, llegamos a un dashboard lleno de números y gráficas, que no nos permite tomar decisiones.Bien porque no muestra los datos con el área de responsabilidad de la persona que toma las decisiones, o simplemente porque son datos no accionables. En cualquiera de los dos casos el resultado es el mismo.
  • Datos incompletos: es el otro extremo del caso anterior. Nos faltan los datos necesarios para tomar decisiones.

Visualización de datos

El segundo gran problema es que la persona que tiene que tomar las decisiones no entienda los datos.
Al igual que tenemos que mostrar a cada stakeholder los datos que son relevantes para su trabajo (caso anterior), tenemos que adaptar el lenguaje y la visualización, para que el decisor entienda lo que está viendo.
Así que, para que un dashboard estratégico funcione debes empezar por tener definir bien los objetivos y KPIs, trabajar la calidad del dato, que estos datos te estén contando lo que te interesa y que integren datos de las diferentes fuentes que manejas.

No te saltes ninguna fase del modelo de madurez de la analítica digital, porque sino te puedes encontrar con los problemas que hemos visto en este post.

Ver Articulo completo

Listado de Tecnicas y Tipos de Analisis Big Data

$
0
0

A continuación, os detallamos las principales técnicas y tipos de análisis que se realizan en Big Data, muchas veces agrupadas bajo nombres como algoritmos, machine learning, etc.... pero que no siempre se explican correctamente

Aquí os hemos creado algunos ejemplos online usando algunas de estas técnicas

Si quieres saber más, puedes consultar también otros posts relacionados:

Las 53 Claves para conocer Machine Learning
69 claves para conocer Big Data
Como empezar a aprender Big Data en 2 horas
Tipos de roles en Analytics (Business Intelligence, Big Data)
Libro Gratuito: Big Data, el poder de convertir datos en decisiones

Veamos pues, cuales son estas técnicas:

1. A/B testing: A technique in which a control group is compared with a variety of test groups in order to determine what treatments (i.e., changes) will improve a given objective variable, e.g., marketing response rate. This technique is also known as split testing or bucket testing. An example application is determining what copy text, layouts, images, or colors will improve conversion rates on an e-commerce Web site. Big data enables huge numbers of tests to be executed and analyzed, ensuring that groups are of sufficient size to detect meaningful (i.e., statistically significant) differences between the control and treatment groups (see statistics). When more than one variable is simultaneously manipulated in the treatment, the multivariate generalization of this technique, which applies statistical modeling, is often called “A/B/N” testing

2. Association rule learning: A set of techniques for discovering interesting relationships, i.e., “association rules,” among variables in large databases.These techniques consist of a variety of algorithms to generate and test possible rules. One application is market basket analysis, in which a retailer can determine which products are frequently bought together and use this information for marketing (a commonly cited example is the discovery that many supermarket shoppers who buy diapers also tend to buy beer). Used for data mining.

3. Classification: A set of techniques to identify the categories in which new data points belong, based on a training set containing data points that have already been categorized. One application is the prediction of segment-specific customer behavior (e.g., buying decisions, churn rate, consumption rate) where there is a clear hypothesis or objective outcome. These techniques are often described as supervised learning because of the existence of a training set; they stand in contrast to cluster analysis, a type of unsupervised learning. Used for data mining.

4. Cluster analysis: A statistical method for classifying objects that splits a diverse group into smaller groups of similar objects, whose characteristics of similarity are not known in advance. An example of cluster analysis is segmenting consumers into self-similar groups for targeted marketing. This is a type of unsupervised learning because training data are not used. This technique is in contrast to classification, a type of supervised learning. Used for data mining.

5. Crowdsourcing: A technique for collecting data submitted by a large group of people or ommunity (i.e., the “crowd”) through an open call, usually through networked media such as the Web.This is a type of mass collaboration and an instance of using Web.

6. Data fusion and data integration: A set of techniques that integrate and analyze data from multiple sources in order to develop insights in ways that are more efficient and potentially more accurate than if they were developed by analyzing a single source of data. Signal processing techniques can be used to implement some types of data fusion. One example of an application is sensor data from the Internet of Things being combined to develop an integrated perspective on the performance of a complex distributed system such as an oil refinery. Data from social media, analyzed by natural language processing, can be combined with real-time sales data, in order to determine what effect a marketing campaign is having on customer sentiment and purchasing behavior.

7. Data mining: A set of techniques to extract patterns from large datasets by combining methods from statistics and machine learning with database management. These techniques include association rule learning, cluster analysis, classification, and regression. Applications include mining customer data to determine segments most likely to respond to an offer, mining human resources data to identify characteristics of most successful employees, or market basket analysis to model the purchase behavior of customers

8. Ensemble learning: Using multiple predictive models (each developed using statistics and/or machine learning) to obtain better predictive performance than could be obtained from any of the constituent models. This is a type of supervised learning.

9. Genetic algorithms: A technique used for optimization that is inspired by the process of natural evolution or “survival of the fittest.” In this technique, potential solutions are encoded as “chromosomes” that can combine and mutate. These individual chromosomes are selected for survival within a modeled “environment” that determines the fitness or performance of each individual in the population. Often described as a type of “evolutionary algorithm,” these algorithms are well-suited for solving nonlinear problems. Examples of applications include improving job scheduling in manufacturing and optimizing the performance of an investment portfolio.

10. Machine learning: A subspecialty of computer science (within a field historically called “artificial intelligence”) concerned with the design and development of algorithms that allow computers to evolve behaviors based on empirical data. A major focus of machine learning research is to automatically learn to recognize complex patterns and make intelligent decisions based on data. Natural language processing is an example of machine learning

11. Natural language processing (NLP): A set of techniques from a subspecialty of computer science (within a field historically called “artificial intelligence”) and linguistics that uses computer algorithms to analyze human (natural) language. Many NLP techniques are types of machine learning. One application of NLP is using sentiment analysis on social media to determine how prospective customers are reacting to a branding campaign.

12. Neural networks: Computational models, inspired by the structure and workings of biological neural networks (i.e., the cells and connections within a brain), that find patterns in data. Neural networks are well-suited for finding nonlinear patterns. They can be used for pattern recognition and optimization. Some neural network applications involve supervised learning and others involve unsupervised learning. Examples of applications include identifying high-value customers that are at risk of leaving a particular company and identifying fraudulent insurance claims.

13. Network analysis: A set of techniques used to characterize relationships among discrete nodes in a graph or a network. In social network analysis, connections between individuals in a community or organization are analyzed, e.g., how information travels, or who has the most influence over whom. Examples of applications include identifying key opinion leaders to target for marketing, and identifying bottlenecks in enterprise information flows.

14. Optimization: A portfolio of numerical techniques used to redesign complex systems and processes to improve their performance according to one or more objective measures (e.g., cost, speed, or reliability). Examples of applications include improving operational processes such as scheduling, routing, and floor layout, and making strategic decisions such as product range strategy, linked investment analysis, and R&D portfolio strategy. Genetic algorithms are an example of an optimization technique

15. Pattern recognition: A set of machine learning techniques that assign some sort of output value (or label) to a given input value (or instance) according to a specific algorithm. Classification techniques are an example.

16. Predictive modeling: A set of techniques in which a mathematical model is created or chosen to best predict the probability of an outcome. An example of an application in customer relationship management is the use of predictive models to estimate the likelihood that a customer will “churn” (i.e., change providers) or the likelihood that a customer can be cross-sold another product. Regression is one example of the many predictive modeling techniques.

17. Regression: A set of statistical techniques to determine how the value of the dependent variable changes when one or more independent variables is modified. Often used for forecasting or prediction. Examples of applications include forecasting sales volumes based on various market and economic variables or determining what measurable manufacturing parameters most influence customer satisfaction. Used for data mining.

18. Sentiment analysis: Application of natural language processing and other analytic techniques to identify and extract subjective information from source text material. Key aspects of these analyses include identifying the feature, aspect, or product about which a sentiment is being expressed, and determining the type, “polarity” (i.e., positive, negative, or neutral) and the degree and strength of the sentiment. Examples of applications include companies applying sentiment analysis to analyze social media (e.g., blogs, microblogs, and social networks) to determine how different customer segments and stakeholders are reacting to their products and actions.

19. Signal processing: A set of techniques from electrical engineering and applied mathematics originally developed to analyze discrete and continuous signals, i.e., representations of analog physical quantities (even if represented digitally) such as radio signals, sounds, and images. This category includes techniques from signal detection theory, which quantifies the ability to discern between signal and noise. Sample applications include modeling for time series analysis or implementing data fusion to determine a more precise reading by combining data from a set of less precise data sources (i.e., extracting the signal from the noise).

20. Spatial analysis: A set of techniques, some applied from statistics, which analyze the topological, geometric, or geographic properties encoded in a data set. Often the data for spatial analysis come from geographic information systems (GIS) that capture data including location information, e.g., addresses or latitude/longitude coordinates. Examples of applications include the incorporation of spatial data into spatial regressions (e.g., how is consumer willingness to purchase a product correlated with location?) or simulations (e.g., how would a manufacturing supply chain network perform with sites in different locations?).

21. Statistics: The science of the collection, organization, and interpretation of data, including the design of surveys and experiments. Statistical techniques are often used to make judgments about what relationships between variables could have occurred by chance (the “null hypothesis”), and what relationships between variables likely result from some kind of underlying causal relationship (i.e., that are “statistically significant”). Statistical techniques are also used to reduce the likelihood of Type I errors (“false positives”) and Type II errors (“false negatives”). An example of an application is A/B testing to determine what types of marketing material will most increase revenue.

22. Supervised learning: The set of machine learning techniques that infer a function or relationship from a set of training data. Examples include classification and support vector machines.30 This is different from unsupervised learning.

23. Simulation: Modeling the behavior of complex systems, often used for forecasting, predicting and scenario planning. Monte Carlo simulations, for example, are a class of algorithms that rely on repeated random sampling, i.e., running thousands of simulations, each based on different assumptions. The result is a histogram that gives a probability distribution of outcomes. One application is assessing the likelihood of meeting financial targets given uncertainties about the success of various initiatives

24. Time series analysis: Set of techniques from both statistics and signal processing for analyzing sequences of data points, representing values at successive times, to extract meaningful characteristics from the data. Examples of time series analysis include the hourly value of a stock market index or the number of patients diagnosed with a given condition every day. Time series forecasting is the use of a model to predict future values of a time series based on known past values of the same or other series. Some of these techniques, e.g., structural modeling, decompose a series into trend, seasonal, and residual components, which can be useful for identifying cyclical patterns in the data. Examples of applications include forecasting sales figures, or predicting the number of people who will be diagnosed with an infectious disease.

25. Unsupervised learning: A set of machine learning techniques that finds hidden structure in unlabeled data. Cluster analysis is an example of unsupervised learning (in contrast to supervised learning).


26. Visualization: Techniques used for creating images, diagrams, or animations to communicate, understand, and improve the results of big data analyses.

Visto en Big Data made simple

El Cuadro de Mando que controla toda tu vida

$
0
0


Anand Sharma, registra sus peripecias vitales como una forma de legar a la posteridad los datos vinculados con su salud. En la web de su proyecto Aprilzero puedes conocer cada minúsculo detalle, y muy pronto publicar también los tuyos.


Trabaja en una herramienta para que cualquier persona pueda monitorizarse a sí misma. Se trata de un nuevo proyecto llamado Gyrosco.pe, que aún está en fase de desarrollo y que es, en definitiva, una segunda versión de Aprilzero abierta a la comunidad, que integra muchos datos:


Si echas un vistazo a su página web, comprobarás que es increible todos los aspectos analizados y se echan algo de menos algunas herramientas tipo informes, dashboards adhoc, etc... para explotar toda esa información 

Visto en el diario

Open Source Business Intelligence tips in March 2017

$
0
0

Ranking de las mejores 50 peliculas y series sobre Analytics y Big Data

$
0
0

Hemos hecho una recopilación, para todos los apasionados del Analytics, Machine Learning y Big Data. Un ranking de las películas y series que, de uno y otro modo, tocan temas que nos gustan en esta web y esperamos que también os gusten a vosotros

Es una lista amplia, incluye películas sobre computacion, biografías de personajes ilustres, de inteligencia artificial, infantiles, de humor, series, documentales, de animación y, en general, que pueden gustar a los apasionados del Analytics.... No dudéis en contarnos vuestras recomendaciones y sugerencias. Quizás, también, descubráis películas que no conociais

Hemos hecho también un ranking, aunando su relación con la materia y su calidad. Evidentemente, es totalmente subjetivo, por parte del equipo de TodoBI.com y seguro que tendréis opiniones diferentes, pero os puede servir de guía


50. The Cube


Se trata de una película de acción, con misterio lógico, de la que se hicieron varias secuelas. Su atmósfera, su relación geométrica y, sobre todo, los recuerdos que nos trae a los análisis muldimensionales nos ha llevado a incluirla


49. Descifrando el Código


Unos cuantos, bastantes, años antes de la aclamada 'The imitation Game' sobre la vida de Alan Turing, se realizó otra película para television, menos recordada, pero que igualmente, merece estar en esta lista.


48. X+Y
Película sentimental, sobre amistad, relaciones personales... en donde las Olimpiadas Matemáticas y el genio adolescente juegan un papel importante


47.  La gran apuesta


Película muy pegada a la actualidad, sobre la burbuja inmobiliaria que sufrimos hace unos años y la ingeniería financiera y matemática que había por detrás y que explican en gran parte lo que sucedió


46. Silicon Valley

Para todos los que estéis embarcados en el lanzamiento de una startup y están negociando con inversores y como lanzar producto, esta es vuestra serie. Tecnología, dinero y emprendedores


45.  Raising Genius


Cuando un adolescente se obsesiona con las matemáticas y se encierra en el baño, las situaciones se pueden precipitar


44. Project Almanac


Jovenes con talento para la física, los inventos, el cálculo y un descubrimiento de viajes en el tiempo


43. The Bank

Cuando especialistas en Informática y Economía se unen para crear un sistema que puede predecir la evolución de la bolsa y ganar grandes cantidades de dinero, no podía faltar en la lista


42. Trabajo Basura


El día a día de un grupo de informáticos en su oficina, en clave de humor, en donde podrás encontrar muchas situaciones que te serán familiares


41. Flatland


Una película animada, con cubos, esferas y dimensiones, que te sorprenderá


40. Atrápame si puedes


Popular película con actores muy conocidos que introduce las posibilidades del manejo de datos para la falsificación, la usurpación de personalidades e información para obtener dinero y vivir de los beneficios


39. La teoría del todo


La biografía de Stephen Hawking, reciente y con grandes interpretaciones, imprescindible para todos los que trabajan con datos y algoritmos


38. Donald en el mágico mundo de las matemáticas


Sí, el título lo explica muy bien. Pelicula de animación de Disney, en donde nuestro pato favorito se encuentra con Pitágoras, entre otros hallazgos


37. Piratas de Silicon Valley


En los comienzos de la informatica de consumo, la rivalidad entre Microsoft y Apple se hacía evidente. Una gran película para los nostálgicos de aquella época


36.  La habitacion de Fermat


Sí, una película española se ha colado en la lista. Dirigida por el monologuista Luis Piedrahita, incluye misterio y desafíos matemáticos para resolver el enigma


35. The Net


Una analista informática descubre que un programa a través de Internet permite acceder a Bases de Datos secretas. Buen planteamiento inicial, no?


34. The rise and rise of bitcoin


Se trata de un documental, también representados en esta lista, en donde se explica de forma muy amena, lo planteado en el título del mismo


33. La red social


Todos sabemos a que red social se refiere el título de la película. Por el impacto que esta red social tiene en nuestras vidas, le hemos reservado el puesto 33


32. Este muerto esta muy vivo


Sí, las comedias también han usado el análisis y explotación de los datos. En esta divertida película, los jóvenes protagonistas descubren manipulación en los datos y fraude de su compañía de seguros, que da pie a muchas situaciones cómicas


31. Superman III


Peliculas de superheroes? Sí, aunque en este caso, la habilidad recae en el personaje interpretado por Richard Pryor, que gracias a su habilidad con los datos y la informática consigue grandes sumas de dinero


30. Nivel 13


Una máquina de realidad virtual, que puede llegar a hacer que no sepas cual es la verdadera y auténtica realidad


29. Juegos de Guerra


Uno de los grandes clásicos representados en esta lista. Un hacker, guerra fría, DEFCON...


28. Almas de Metal


Quizas, ahora que se ha estrenado la serie de Westworld, como secuela, parezca antigua. Pera esta película y la actuacion de Yul Brynner son enormes


27. Codebreaker


Gran documental sobre la vida de Alan Turing, incluyendo muchos testimonios y entrevistas, como la de Steve Wozniak


26. El cortador de césped


Película que describe bastante bien, con intensidad y tensión, los experimentos para conseguir un aumento de la intelligencia, basada en una novela de Stephen King


25. Intelligence


Imagina que en tu cerebro tienes un chip que te permite estar conectado a Internet y a otras muchas redes de seguridad. Esta serie aplicaba dicha premisa


24. PI


Pueden las matemáticas explicar todo el mundo que nos rodea? Desde aplicarse a la bolsa, como al mundo de los negocios, en una película thriller y ciencia ficción que no deja indiferente, como es el cine de Aronofsky


23. Big Bang Theory


Humor, en esta ya larga sitcom, que sabemos que cuenta con muchos seguidores entre la comunidad de Data Scientist


22. Metropolis


La obra clásica del año 1927, de Fritz Lang, que describe como sería el mundo en el 2026 (queda poco) y que cobra actualidad con las dudas sobre el trabajo en el futuro y quien lo realizará. Pelicula es considerada 'Memoria de la Unesco'
Probablemente, también, uno de los mejores diseños de carteles cinematográficos


21. Ex_Machina


Probando la inteligencia artificial. Una de las mejores películas de los últimos años dentro de este género


20.  2001, una odisea en el espacio


No podía faltar el clásico de Stanley Kubrick,  basado en el las novelas de Arthur C. Clark, que creó una nueva forma de plasmar la tecnología, ciencia ficción y realidad virtual, con un nuevo lenguaje visual. HAL --- IBM


19. Person of Interest


Gran ejemplo de manejo de datos, análisis predictivo, smart cities, vigilancia inteligente para predecir crímenes en esta serie con ilustres creadores


18. Tron


Un nuevo clásico. Los juegos han sido un componente fundamental en el desarrollo de la computación y en la explotación masiva de datos. Por cierto, la película original, no la secuela


17. Yo Robot


Los robots ya forman parte de la vida cotidiana, la inteligencia artificial cada vez es mas evolucionada


16. Snowden


Las brechas de datos que, cada vez con más frecuencia, son divulgadas ponen de manifiesto el uso que hacen de ellos los gobiernos y grandes multinacionales. Una buena historia de un informático, basada en hechos reales


15. Blade Runner


Esta película, precursora de muchas otras, en cuanto a predicción del impacto de la tecnología en nuestra sociedad, no podía faltar.
"Yo he visto cosas que vosotros no creeríais. Atacar naves en llamas más allá de Orión. He visto Rayos-C brillar en la oscuridad cerca de la puerta de Tannhäuser. Todos esos momentos se perderán en el tiempo... como lágrimas en la lluvia. Es hora de morir"


14.  Mentes Criminales


Esta serie, que cuenta con muchísimas temporadas a sus espaldas, hace un uso muy acertado del análisis de bases de datos en tiempo real, cruces de información, etc... para atrapar a los asesinos


13. Matrix


Matrix (ojo, la primera película), es indispensable en este ranking. Tanto en el aspecto estético, la recreación del universo onírico, como por sus implicaciones tecnológicas.


12. Margin Call


Los activos tóxicos pueden derrumbar una gran empresa, si no se han analizado correctamente los datos y analizado las previsiones. En esta película se explica perfectamente


11. Mr. Robot


Una de las series más recientes que, desde el punto de vista de los hackers y los programadores, deja clara la importancia y protagonismo que pueden alcanzar


10. AI, Inteligencia Artificial


Una de las películas que mejor explicaban lo que podría suponer la Inteligencia Artificial. Un proyecto que inicialmente iba a realizar Stanley Kubrick, pero que finalmente fue Spielberg


9. Her


Te puedes enamorar de un nuevo sistema operativo avanzado? Una historia original y bien planteada


8. 21


Si eres un gran matemático en el MIT, probablemente también puedes hacer dinero en Las Vegas, aprovechando el talento. Además, de ser una gran forma de demostrarlo


7. El indomable Will Hunting


Tener talento para el cálculo y las matemáticas, no tiene por qué obligatoriamente a querer ser un alumno destacado de una gran Universidad o de una gran empresa


6. The Prestige


"Cualquier tecnología lo suficientemente avanzada es indistingible de la magia" (Arthur C. Clark)


5. Una mente maravillosa


La historia del nobel de Economía, John Nash, matemático que sufría de esquizofrenia, debe estar entre las cinco destacadas


4. Minority Report


Una de las mejores películas de ciencia ficción y de acción que reflejan la importancia del análisis de la información, el análisis predictivo y la visualización avanzada


3. Black Mirror


La serie británica, cuyos capítulos son independientes, aborda de forma magistral el impacto de la tecnología en la vida cotidiana. Muchos de sus capítulos, anticipan realidades a la vuelta de la esquina


2. Moneyball


Se trata de la película que aborda de forma más clara y evidente, el beneficio de aplicar business intelligence. En este caso a la gestión de equipos deportivos. Además, esta basada en hechos reales


1. The imitation Game


Sin duda, el homenaje cinematográfico a Alan Turing, además se corresponde con una gran película que arroja las luces sobre uno de los grandes genios de la computación y el análisis de datos al que no se reconoció su labor en vida


Bonus: Películas convertidas en visualizaciones


This is great, Fantasy Map Generator

$
0
0


It is a Fantasy Map Generator based on D3 Voronoi diagram rendered to scalable svg.
Use random to genarate the map with default options, customize to make your own shape.


Project goal is to create a procedural generated map for my Medieval Dinasty game simulator. So a map should be interactive, fast and plausible-looking. The easiest way is to generate Isles that will have enought place to locate at least 500 manors within 7 cultural areas. The imagined area is about 20.000 km2 (like Wales shaped as Isles of Scilly).

¿Que es OLAP?

$
0
0
olap2

En muchos de los artículos que aquí comentamos aparece el término OLAP. Aunque otras veces hablemos de multidimensional, de cubos... nos referimos a lo mismo.
Dado que es uno de los temas que más me interesan voy a intentar explicar que significa, que características tiene y, sobre todo, para que nos puede ser útil.

OLAP significa ‘On-Line Analytical Processing’, que se contrapone con el término OLTP ‘On-Line Transactional Processing’. Término más habitual, que define los sistemas de bases de datos relacionales usadas ampliamente en el mundo empresarial.
En estos últimos sistemas lo importante es el registro de los datos, y en OLAP, lo importante es el análisis. Esta es la diferencia más general que os puedo dar. Pero existe mucho más.

Ver cubos en funcionamiento, desde informes y Cuadros de Mando (Demo Online)

Es importante saber ésto, por que muchos vendedores dicen que tienen productos con capaciadad OLAP, cuando ésto no es cierto del todo.

Desde el punto de vista teórico un sistema OLAP debe cumplir las reglas del Dr. Codd, recientemente fallecido, y 'padre' del concepto:
  1. Se tiene que tener una visión multidimensional de los datos. Pensar en dimensiones y métricas de Negocio. No en tablas y en campos.
  2. La manipulación de los datos tiene que ser intuitiva y sencilla. Son los análistas y altos ejecutivos los que manejan estas herramientas, y hay que pensar en ello.
  3. El motor OLAP debe ser un organizador intermedio para que las aplicaciones finales: Cuadros de mando, Scorecard, aplicaciones de análiticas financieras, etc... provean de datos al usuario.
  4. Posibilidad de acceder a datos almacenados directamente o en procesos batch, desde el relacional. Es decir, posibilidad de tener un sitema híbrido. Algo más parecido a un sistema HOLAP.
  5. Creación de modelos basados en OLAP. Este requerimiento es muy subjetivo y depende de la complejidad de los modelos. Cuantos más tipos de modelo, mejor OLAP será.
  6. Arquitectura Cliente/Servidor, pensado como la posibilidad de que los usuarios interactuen y colaboren en la aplicación.
  7. Transparente para los usuarios. Se debe ocultar la capa de complejidad, de procesos batch, de cargas ETL... dejando sólo una capa de abstracción de negocio.
  8. Acceso multiusuario a las aplicaciones, de forma concurrente, con posibilidad de modificaciones, estableciendo colas de trabajo, etc...
  9. Integracion de datos no normalizados en el cubo OLAP, que garanticen que las modificaciones en datos no origen no afectan a los datos finales.
  10. Mantener los cálculos y resultados de queries OLAP separados y almacenados en una ubicación diferente del sistema fuente.
  11. DIferenciación de los valores vacíos de los valores 0. Muy importante a la hora de realizar cálculos matemáticos.
  12. Posibilidad de ignorar todos los valores vacíos, las celdas del cubo sin datos.
  13. Flexibilidad en la creación de informes.
  14. Rendimiento uniforme de todos los informes, es otra forma de hacer 'transparente' la aplicación.
  15. El sistema OLAP debe adaptar automáticamente su estructura según sean las dimensiones, métricas, etc... ésto no es fácil y, generalmente, requiere intervención manual.
  16. Posibilidad de crear dimensiones de cualquier tipo.
  17. Sin límite de dimensiones, niveles de agregación, jerarquías, etc... Debe ser la complejidad del negocio la que marque el límite.
  18. No establecer restricciones a las operaciones que crucen cualquier dimensión o elementos de la dimensión.
Desde un punto de vista práctico me gustaría añadir algunas otras características:

- Debe ser rápido. No debe transcurrir mucho tiempo entre la necesidad de información y el resultado.
- Debe tener un lenguaje funcional y de negocio.
- Debe ser de manejo sencillo, con wizards y templates.
- Debe poder integrar API.
- Debe tener potentes posibilidades gráficas.
- Debe utilizar mapas de forma habitual.
- Posibilidad de almacenar y compartir los informes y cálculos creados por los usuarios.
- La administración la deben llevar los usuarios, no IT.
- El tiempo de implementación (proyecto) debe ser muy corto.
- Deber generar respuestas medibles para la toma de decisiones.
- Tenemos que ser capaces de obtner ROI con las aplicaciones OLAP.
Mas info: MOLAP, ROLAP, HOLAP no es solo jerga 

Tags: Destacado, teoria

Quieres trabajar en Big Data/Analytics y tienes ganas de aprender?

$
0
0


Tenemos un plan de formación y carrera para profesionales con una base inicial y muchas ganas de aprender. Escríbenos a rrhh@stratebi.com

Podrás participar en proyectos y en desarrollos con las tecnologías más modernas, como Dashboards en tiempo real


·        Requisitos:
o   Descripción: Una persona con interés en Big Data, no es necesaria mucha experiencia, pero con ganas de aprender y formar equipo. Por ejemplo, i), una persona que acabe de terminar una Ingeniería Informática y/o su trabajo de fin de carrera sea sobre Big Data, ii), una persona que esté haciendo I+D en Big Data  o iii), que haya hecho un máster en Big Data 
o   Salario: Según valía
o   Habilidades:
§  Imprescindibles:
·         Conocimientos teóricos básicos de Big Data.
o   Qué es el Big Data.
o   Debe tener claro el paradigma Map Reduce.
·  Conocimientos teóricos básicos de las siguientes tecnologías de arquitectura Hadoop.
o   HDFS
o   Spark
·         Conocimientos teóricos sobre Machine Learning.
·     Programación en i) Python y ii) Scala o Java para Machine Learning, con mínima experiencia demostrable 
·         Conocimiento de Bases de Datos
o   Soltura con lenguaje SQL.
o   Modelado relacional.
o   Experiencia mínima demostrable en al menos uno de los siguientes SGBD:
§  MySQL
§  PostgreSQL
§  Microsoft SQLServer
§  Oracle
§  Opcionales (alguno de estos conocimientos serían muy interesantes):
·         (+) Conocimientos teóricos básicos de arquitectura Hadoop.
o   Hive
o   HBase
o   Kafka
o   Flume
o   Distribuciones Cloudera o Hortonworks:
§  Características
§  Instalación.
·         Conocimientos teóricos Business Intelligence
o   Teoría de Data Warehouses.
§  Modelado en estrella.
·         Experiencia con alguna herramienta de ETL.
o   Ideal con Pentaho Data Integration o Talend
o   Cualquier otra.
·         Experiencia en diseño y carga de un Data Warehouse.


Comparativa de herramientas Business Intelligence

$
0
0

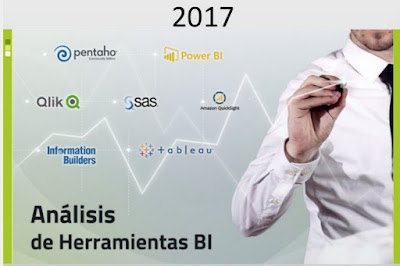
Os presentamos un Estudio muy completo de unas 300 páginas que han realizado nuestros compañeros especialistas en Business Intelligence, Stratebi, con una comparativa y análisis detallados de algunas de las herramientas Business Intelligence que más aceptación están teniendo ultimamente:

- PowerBI
- Tableau
- Qlikview
- Pentaho
- SAS
- Information Builders
- Amazon Quicksight

Un estudio muy completo para todos los interesados en implementar una solución business intelligence


Main trends in Business Intelligence in 2017

$
0
0
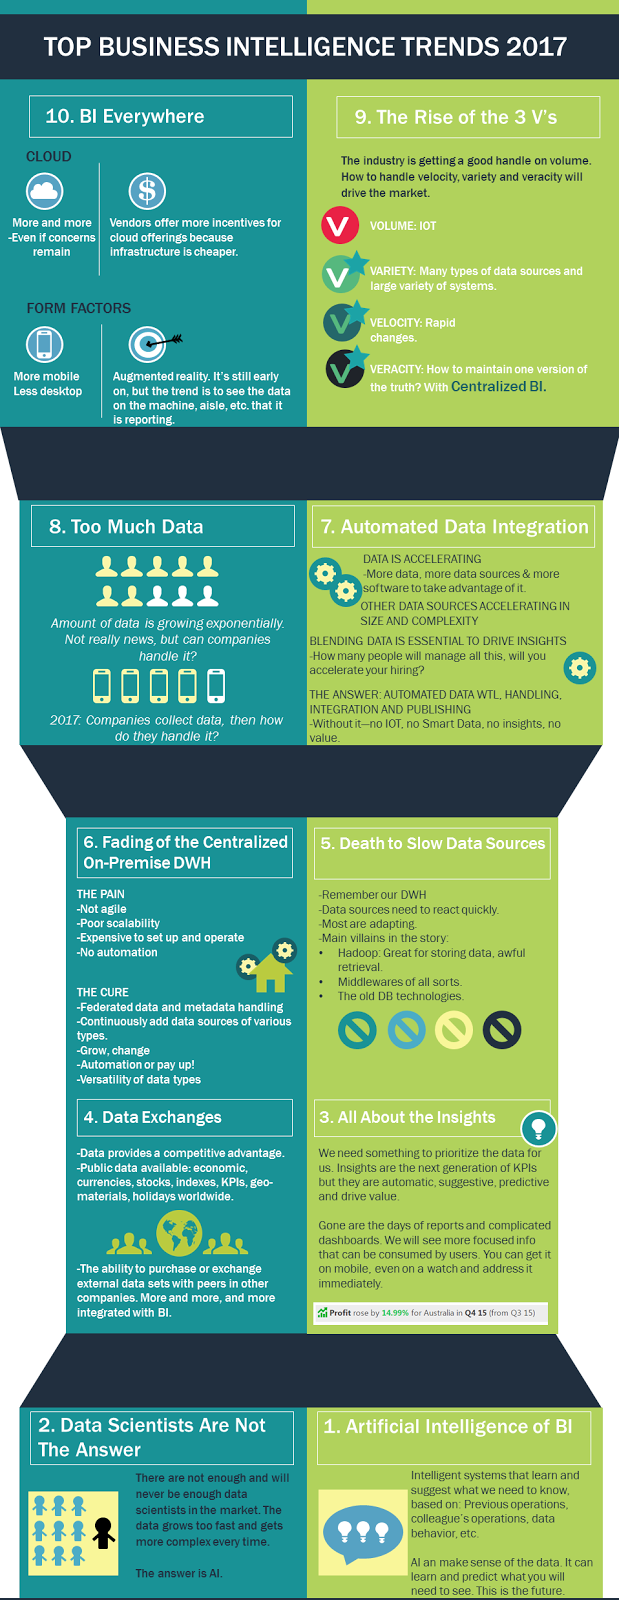
Here you can see, main trends in Business Intelligence during this year. Most of them, we spoke here in this blog in previous posts


Thanks to Panorama Software

Como añadir forecasting y planificación a Qlikview

$
0
0


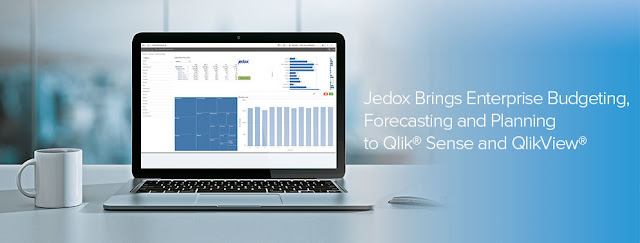
If you are using Qlik for data discovery and visual analytics and are looking for a natural extension for best-in-class enterprise planning? 

With the Jedox Qlik Sense and QlikView Connectors you leverage your analytics investment for a unified planning solution with a single, centrally governed data model that’s easy to use for everyone in the company. Ver en acción 
  • Seamless Visualization and Planning with Qlik and Jedox
  • Data Entry, Collaboration and Write-Back Capabilities
  • Enterprise-Class Features for Planning such as Workflows, Auditing, and more…


Curso de Visualizacion y Cuadros de Mando Open Source

$
0
0

Nos los estabais pidiendo. Hemos convocado una nueva edición del Curso Online para crear Dashboards con tecnologías open source. Serán lo días 24 y 25 de Mayo de 15:00h a 20:00h

Será un curso muy práctico en el que es imprescindible las ganas de aprender y de dejar volar la imaginación con la visualización

Todos los detalles del curso aquí, (temario, inscripción...) no te quedes sin plaza!! 


Temario

Introducción a Cuadros de Mando

Buenas prácticas en Cuadros de Mando

ScoreCards y Cuadros de Mando

Cuadros de Mando custom 

  • Diferentes tecnologías y ejemplos

Tecnologías CDF y CDE

Instalación CDE

Trabajando con CDE

Explicación de Layouts

Componentes

Extracción de datos (Tecnología CDA)

  • Estructuras de ficheros
  • Origen Kettle
  • Definición Origen (JNDI)
  • Consultas MDX y SQL

Elementos Gráficos

Parametrización y dependencias

Interacción entre elementos gráficos

Elementos avanzados

  • Integración de librerías gráficas externas

Aplicación de Estilos CSS

Javascripting

Inclusión de mapas

Otros tipos de Cuadros de Mandos

Exportación del cdm

CDM para dispositivos móviles

Ejercicios avanzados


Público objetivo

Profesionales de las tecnologías de información, gestores de TI, Analistas de Negocio, Analistas de sistemas, arquitectos Java, desarrolladores de sistemas, administradores de bases de datos, desarrolladores y profesionales con relación a el área de tecnología, marketing, negocio y financiera.


Algún ejemplo de lo que veremos:


Ejemplos de lo que podréis hacer:

- Ver ejemplos en funcionamiento de Cuadros de Mando Open Source
- Ver Galería de Cuadros de Mando

- Ver Cuadros de Mando con tecnologías Big Data 'Real Time

Nuevas funcionalidades en PostgreSQL 10

$
0
0

Muy intersantes, las nuevas funcionalidades que se anuncian para las versión PostgreSQL 10:

Headline Features

Declarative Partitioning.  In previous versions of PostgreSQL, PostgreSQL supported only table inheritance, which could be used to simulate table partitioning, but it was complicated to set up and the performance characteristics were not that great.  In PostgreSQL 10, it's possible to do list or range partitioning using dedicated syntax, and INSERT performance has been greatly improved.  There is still a lot more work to do in future releases to improve performance and add missing features, but even what we have in v10 is already a major step forward (IMHO, anyway).

Logical Replication.  PostgreSQL has had physical replication -- often called streaming replication -- since version 9.0, but this requires replicating the entire database, cannot tolerate writes in any form on the standby server, and is useless for replicating across versions or database systems.  PostgreSQL has had logical decoding -- basically change capture -- since version 9.4, which has been embracedwithenthusiasm, but it could not be used for replication without an add-on of some sort.  PostgreSQL 10 adds logical replication which is very easy to configure and which works at table granularity, clearly a huge step forward.  It will copy the initial data for you and then keep it up to date after that.

Improved Parallel Query.  While PostgreSQL 9.6 offers parallel query, this feature has been significantly improved in PostgreSQL 10, with new features like Parallel Bitmap Heap Scan, Parallel Index Scan, and others.  Speedups of 2-4x are common with parallel query, and these enhancements should allow those speedups to happen for a wider variety of queries.

SCRAM Authentication.  PostgreSQL offers a remarkable variety of different authentication methods, including methods such as Kerberos, SSPI, and SSL certificate authentication, which are intended to be highly secure.  However, sometimes users just want to use passwords managed by the PostgreSQL server itself.  In existing releases, this can be done either using the password authentication type, which just sends the user-supplied password over the wire, or via the md5 authentication type, which sends a hashed and salted version of the password over the wire.  In the latter approach, stealing the hashed password from the database or sniffing it on the wire is equivalent to stealing the password itself, even if you can't compute a preimage.  PostgreSQL 10 introduces scram authentication, specifically SCRAM-SHA-256, which is much more secure.  Neither the information which the server stores on disk nor the contents of an authentication exchange suffice for the server to impersonate the client.  Of course, the substitution of SHA-256 for MD5 is also a substantial improvement.  See also Michael Paquier's blog on this topic. One point to note is that, unless you are using libpq, you will not be able to use this feature unless your particular client driver has been updated with SCRAM support, so it may be a while before this feature is universally available.

Executor Speedups.  Substantial parts of PostgreSQL's executor have been rewritten to make expression and targetlist projection faster; just-in-time compilation will be added in a future release.  Hash aggregation has been rewritten to use a more efficient hash table and store narrower tuples in it, and work has also been done to speed up queries that compute multiple aggregates and joins where one side can be proven unique.  Grouping sets now support hash aggregation.  While all PostgreSQL releases typically contain at least some performance improvements, the rewrite of expression and targetlist projection is a particularly large and significant improvement which will benefit many users.

Durable Hash Indexes.  Hash indexes in PostgreSQL have suffered from years of long neglect; the situation will be noticeably improved in v10.  The most notable change is that changes to a hash index now write WAL, which means that they are crash-safe and that they are properly replicated to standbys.  However, a good deal of other work has been done, including the necessary prerequisite step of revamping the bucket split algorithm to improve performance and concurrency, caching the metapage for better performance, adding page-at-a-time vacuuming, and expanding them more gradually.  Amit Kapila even writes about a case where they outperformed btree indexes.  While there's certainly more work to be done here, I'm excited about these improvements.

ICU Collation Support.  In current releases, PostgreSQL relies exclusively on the collations supplied by the operating system, but this sometimes causes problems: collation behavior often differs between operating systems, especially between Linux and Windows, and it isn't always easy to find a collation for one operating system whose behavior matches that of some collation available on another system.  Furthermore, at least on Red Hat, glibc regularly whacks around the behavior of OS-native collations in minor releases, which effectively corrupts PostgreSQL's indexes, since the index order might no longer match the (revised) collation order.  To me, changing the behavior of a widely-used system call in a maintenance release seems about as friendly as locking a family of angry racoons in someone's car, but the glibc maintainers evidently don't agree.  (In fact, there's one discussion where it's suggested that you not use some of those interfaces at all.)  libicu, on the other hand, says they care about this.

But Wait, There's More!

In my estimation, the features listed above are the most exciting things that users can expect in PostgreSQL 10, which is expected to be released in September.  However, there are quite a few other significant features as well which could easily have qualified as headline features in a release less jam-packed than this one.  Here are some of them:

Extended Statistics (ndistinct, functional dependencies).  If the query planner makes a bad row count estimate resulting in a terrible plan, how do you fix it?  With extended statistics, you can tell the system to gather additional statistics according to parameters that you specify, which may help it get the plan right.

FDW Aggregate Pushdown.  In previous releases, SELECT COUNT(*) FROM foreign_table operated by fetching every row form the foreign table and counting them locally.  That was terrible, so now it doesn't.

Transition Tables.  It is now possible to write a PL/pgsql AFTER STATEMENT trigger which can access all rows modified by the statement.  This can be both faster and more convenient than writing an AFTER ROW trigger that is called once per row.

Improved Wait Events.  PostgreSQL 9.6 introduced wait event monitoring in pg_stat_activity, but only for a limited range of events.  In PostgreSQL 10, you'll be able to see latch waits and I/O waits, even for auxiliary processes and unconnected background workers.

New Integrity Checking Tools.  You can now validate the integrity of your btree indexes using the new amcheck module.  If you're a developer adding write-ahead logging to a new storage form, or a user who thinks the developers may have introduced a bug, you'll be pleased to be able to test with wal_consistency_checking. pg_dump now has better test coverage.

Smarter Connection Handling.  Connections through libpq can now specify multiple hosts, and you can even tell it to find you the server that is currently accepting write connections.

Quorum-Based Synchronous Replication.  You can now specify that a commit must be acknowledged by any K of N standby synchronous servers, improving flexibility and performance.

Other Cool Stuff

Many other things have also been significantly improved in this release.  XMLTABLE makes querying XML data faster and easier.  You can now interrogate the commit status of a transaction directly, and we've got better tracking of replication lag.  psql now supports \if ... \elseif ... \else ... \endif to make scripting easier, and there are new functions and new roles to allow monitoring tools to run without superuser privileges.  Encoding conversions are now faster, and so is sorting. You can compress the transaction log while streaming it.  And there's more, but this blog post is too long already.  If you're interested in reading even more about new features that will be coming with PostgreSQL 10, depesz blogs frequently on this topic, and so does Michael Paquier.  Both have additional details on some of the features mentioned here, as well as others that may be of interest.

This final note: we have had chronic problems with users erroneously believing that the pg_xlog or pg_clog directory is non-critical data, possibly because the directory names include the word "log".  Those directories have been renamed to pg_wal and pg_xact, which we hope will be clearer.  All SQL functions and utility names that formerly included the string "xlog", meaning the transaction log or write-ahead log, have been renamed to use "wal" instead.  Conversely, the default log directory is now called log rather than pg_log so that it is looks less like an internal name.  These changes will probably cause a bit of upgrade pain for some users, but we hope that they will also help users to avoid catastrophic mistakes.


Visto en Robert Haas Blog

Trabajar en Business Intelligence

$
0
0

El trabajo en el area de Business Intelligence es uno de los más demandados y apasionantes. Si tienes experiencia en BI o quieres aprender y desarrollar tu carrera este área, esto puede interesante:

En Stratebi (creadores del Portal TodoBI), disfrutarás con la gran cantidad de oportunidades en las áreas tecnológicas de mayor desarrollo en la actualidad: Business Intelligence, Big Data y Machine Learning, basadas en soluciones Open Source.

Nuestras soluciones, como LinceBI,y las principales herramientas del mercado, posibilitan a nuestros clientes ser más inteligentes, rápidos y flexibles que sus competidores más directos. Este es el verdadero poder de una organizacion.


Estas soluciones son la piedra angular del negocio de las organizaciones: campañas de marketing, reporting y análisis, financial scorecard, CRM, cuadros de mando, etc... Para poder desarrollar estas soluciones se necesita a las personas más valiosas y brillantes del área Business Intelligence. Eso es lo que buscamos y en lo que se deben convertir nuestros consultores.

Queremos formar un equipo con una alta motivación emprendedora, en donde todos sus miembros se sientan satisfechos por la calidad del trabajo y las relaciones con el resto de empleados.

Envia tu CV a rrhh@stratebi.com

Posiciones abiertas:

- Ingenieros con interés en aprender y trabajar en Business Intelligence
- Consultores con experiencia en Business Intelligence
Debido a la ampliación de operaciones en Madrid y Barcelona, estamos buscando verdaderos apasionados por el Business Intelligence y que tengán interés en soluciones Open Source y en el desarrollo de tecnologías abiertas. Y, sobre todo, con ganas de aprender en nuevas tecnologías como Big Data, Social Intelligence, etc...

Si estas leyendo estas lineas, seguro que te gusta el Business Intelligence. En Stratebi y TodoBI, estamos buscando a personas con gran interés en este área, que tengan una buena formación técnica y/o experiencia en la implementación de proyectos Business Intelligence en importantes empresas con (Oracle, MySQL, Powercenter, Business Objects, Cognos, Pentaho, Microstrategy...) o desarrollos web adhoc. Mucho mejor, si además fuera con BI Open Source, como Pentaho, Talend... y conocimientos de tecnología Big Data y Social Media, orientado a la visualización y front-end

Todo ello, será muy útil para la implementación de soluciones BI/DW con la plataforma BI Open Source que está revolucionando el BI: Pentaho, con la que más trabajamos, junto con el desarrollo de soluciones Big Data, Social Intelligence y Smart Cities.

Si ya conoces, o has trabajado con Pentaho u otras soluciones BI Open Source será un punto a favor. De todos modos, nuestro Plan de Formación te permitirá conocer y mantenerte actualizado en estas soluciones.
¿Quieres saber un poco mas sobre nosotros y las características de las personas y perfiles que estamos buscando para 'subirse al barco'?

¿Qué ofrecemos?


  • Trabajar en algunas de las áreas de mayor futuro y crecimiento dentro del mundo de la informática: Business Intelligence, Big Data y el Open Source.
  • Colaborar en la mejora de las soluciones Bi Open Source, entre las que se encuentran desarrollando algunas de las empresas tecnológicas más importantes.
  • Entorno de trabajo dinámico, aprendizaje continuo, variedad de retos.
  • Trabajo por objetivos.
  • Considerar el I+D y la innovación como parte principal de nuestros desarrollos.
  • Retribución competitiva.
  • Ser parte de un equipo que valora a las personas y al talento como lo más importante.

BI meet Big Data, a Happy Story

$
0
0

Cada vez esta más cerca poder hacer análisis BI OLAP tradicionales sobre entornos Big Data, gracias a Kylin. Hace unas semanas, lo comentábamos en esta entrada, en donde también mostrábamos ejemplos reales de vistas OLAP y Dashboards en funcionamiento.


Ahora, os actualizamos con información reciente de los programadores de Kylin (inglés)

What is Apache Kylin?

Kylin is an OLAP engine on Hadoop. As shown in Figure 1, Kylin sits on top of Hadoop and exposes relational data to upper applications via the standard SQL interface.
Get O'Reilly's weekly data newsletter

Kylin can handle big data sets and is fast in terms of query latency, which differentiates it from other SQL on Hadoop. For example, the biggest instance of Kylin in production that we’re aware of is at toutiao.com, a news feed app in China. This app has a table of three trillion rows and the average query response time is less than one second. We’ll discuss what makes Kylin so fast in the next section.

Another feature of the Kylin engine is that it can support complex data models. For example, there is a 60-dimension model running at CPIC, an insurance group in China. Kylin provides standard JDBC / ODBC / RestAPI interfaces, enabling a connection with any SQL application.


Kyligence has also developed an online demo, showcasing the BI experience on 100 million airline records. Check it out to learn, for example, the most delayed airline to San Francisco International Airport in the past 20 years. (Login with username “analyst”, password “analyst”, select the “airline_cube”, drag and drop dimensions and measures to play with the data set.)

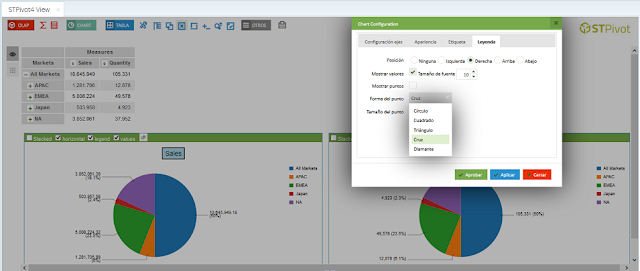
Available new Open Source OLAP viewer, STPivot4

$
0
0


STPivot4 is based on the old Pivot4J project where functionality has been added, improved and extended. These technical features are mentioned below.

Update: STPivot4 now is working with Pentaho 7. Run to download!!


GitHub STPivot4
For additional information, you may visit STPivot4 Project page at http://bit.ly/2gdy09H

Main Features:
  • STPivot4 is Pentaho plugin for visualizing OLAP cubes.
  • Deploys as Pentaho Plugin
  • Supports Mondrian 4!
  • Improves Pentaho user experience.
  • Intuitive UI with Drag and Drop for Measures, Dimensions and Filters
  • Adds key features to Pentaho OLAP viewer replacing JPivot.
  • Easy multi-level member selection.
  • Advanced and function based member selection (Limit, Ranking, Filter, Order).
  • Let user create "on the fly" formulas and calculations using
  • Non MDX gran totals (min,max,avg and sum) per member, hierarchy or axis.
  • New user friendly Selector Area
  • and more…


Listado de tecnologías para Machine Learning

$
0
0


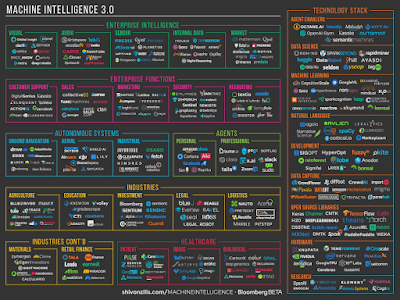
Aquí tenéis un listado bastante actualizado de herramientas y tecnologías, agrupadas por temática, para trabajar con Machine Learning

Gracias a http://www.shivonzilis.com/

Novedades en Pentaho 7.1

$
0
0


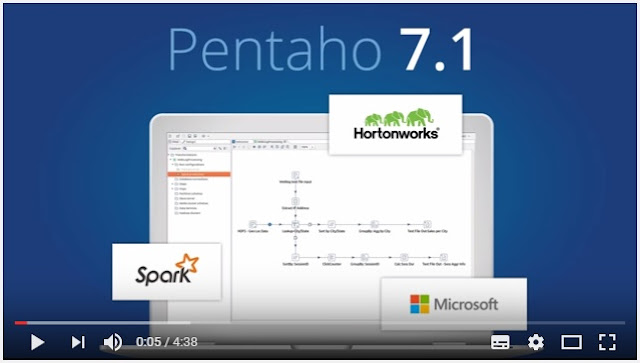
Como os hemos venido informando en nuestra cuenta de twitter, esta pasada semana se ha presentado la versión Pentaho 7.1

- Pentaho 7.1 en Github
- Pentaho 7.1 en Sourceforge

Os contamos las novedades y os pasamos los enlaces más interesantes:

- Novedades en Pentaho 7.1

- Descripción de mejoras por Pedro Alves

- Descripción de mejoras por Diethard Steiner

- Descripción de mejoras por Hemal Govind 

   Create Once, Execute on Any Engine, Starting with Spark

With adaptive execution on Spark in a visual environment, Pentaho 7.1 makes big data developers more productive and Spark more accessible to non-developers. Users can now create data integration logic one time, and then choose the most appropriate big data processing engine for each workload at run-time. This release starts with Spark, but can easily support other engines in the future.

  • Complete Spark Support: Pentaho is the only vendor to support Spark with all data integration steps in a visual drag-and-drop environment. Unlike other vendors who require users to build Spark-specific data integration logic – and often require Java development skills – with Pentaho you only need to design your logic once, regardless of execution engine.
  • Adaptive Execution on Big Data: Transitioning from one engine for big data processing to another often means users need to re-write and debug their data integration logic for each engine, which takes time. Pentaho’s adaptive execution allows users to match workloads with the most appropriate processing engine, without having to re-write any data integration logic.

   More CLOUD options WITH MICROSOFT AZURE HDINSIGHT

Building on current cloud support for Amazon EMR, Pentaho 7.1 supports Microsoft Azure HDInsight, Azure SQL, and SQL Server in Azure VM, offering more options to store – and more importantly, process – big data in hybrid, on-premises, and public cloud environments.
  • Support for HDInsight: Organizations using Microsoft Azure HDInsight can now use Pentaho to acquire, blend, cleanse and analyze diverse data at scale.
  • Process Data in the Cloud or On-Premises: Most vendors only allow you to access data from cloud sources. With Pentaho 7.1, you can also choose to process data on-premises, in the cloud or using a hybrid approach.

   IMPROVED DATA VISUALIZATIONS ACROSS THE PIPELINE

Pentaho 7.1 speeds up time to insight by allowing users to access visualizations at every step of the data prep process. In addition, simplified integration of third party visualizations drives improved analytics along the entire data pipeline. 
  • Prepare Better Data, Faster: More visualizations throughout the data prep process allows users to spot check data for quality issues and prototype analytic data, without switching in and out of tools or waiting until the very end to discover data quality problems. Now, users can interact with heat grids, geo maps, and sunbursts, as well as drill-down into data sets for further exploration.   
  • Integrate 3rd Party Visualizations: Leverage an easy to use and flexible API with full documentation to integrate visualizations from third party libraries such as D3 or FusionCharts.


   Expanded ENTERPRISE-LEVEL SECURITY FOR HORTONWORKS

Concerns over the lack of comprehensive security and authentication for big data environments are top of mind for IT organizations. Pentaho 7.1 gives customers more options by expanding on existing enterprise-level Hadoop security for Cloudera with a similar level of security for Hortonworks.
  • Kerberos Impersonation Support: Address authentication vulnerabilities with Hortonworks deployments. Protect clusters from intrusion and reduce risk with enterprise-level security.
  • Apache Ranger Support: Control role-based access to specific data sets and applications for Hortonworks deployments. Manage governance and risk with authorization.

Download eBook: Data Scientist, a step-by-step Guide

$
0
0

This compact, informative guide to the world of Data Science will have you up-to-date in no time.

What’s in the eBook?


  • Data Scientists –What do they do?
  • Pre-requisites for becoming a Data Scientist
  • Must-have skill-sets
  • Study-Plan
  • What the future holds

Download your free copy

Gran estudio sobre Transformacion Digital

$
0
0


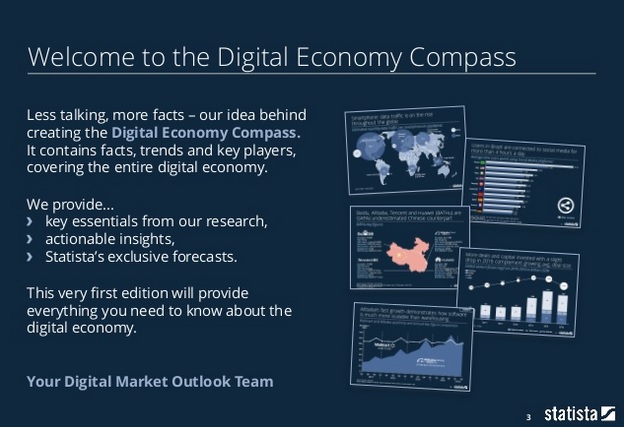
Os recomendados este gran estudio de Statista, muy actual y reciente, sobre el impacto de la tecnología y la transformación digital


Viewing all 866 articles
Browse latest View live