Quantcast
Channel: Business Intelligence y Big Data: ¡Aprende Gratis sobre Analytics!
Viewing all 866 articles
Browse latest View live

Conoce las novedades de Jedox 7 en este video

$
0
0

En este vídeo puedes ver una presentación de las novedades de Jedox 7, la mejor herramienta Business Intelligence para planificación, presupuestación, ratios, reglas de negocio y forecasts


Kylin, analisis OLAP sobre Big Data, viene con novedades para 2017

$
0
0
Cada vez es más factible poder realizar análisis OLAP sobre entornos Big Data, gracias a Apache Kylin, con visualización con Tableau, Pentaho, etc.... Si quieres saber más, pincha estos posts: OLAP for Big Data. It´s possible? y Analysis Big Data OLAP sobre Hadoop con Apache Kylin que hemos publicado recientemente

Hoy os traemos las novedades que para comienzos de este 2017 nos presentan (puedes preguntar a nuestros amigos especialistas de Stratebi para cualquier duda):

Principales características comunes de KAP

-          Interfaz gráfica: Modelado, construcción y consulta SQL del cubo a través de una interfaz web simplificada.

-          Soporte para la extensión mediante plugins

-          Despliegue no intrusivo: La instalación es totalmente independiente del clúster Hadoop y se comunica con dicho clúster a través de una API.

-          KyAnalyzer: Herramienta de análisis OLAP basada en Saiku Server que se incluye con Kyligence.

-          Integración con las principales herramientas de Business Intelligence: Gracias al soporte para conexiones ODBC/JDBC y una API rest, es posible conectar con herramientas como Tableu, Microsoft PowerBI, Apache Zeppelin, Saiku Server o Pentaho & STPivot.

-          Compatibilidad con las distintas versiones de Hadoop:
o   Apache Hadoop (Open Source Stack)
o   Distribuciones:
§  Hortonworks HDP
§  Cloudera CDH
o   Nube SaaS
§  Microsoft HDInsight
§  AWS EMR

-          KyStorage (Solo en versión Enterprise Plus): La versión Enterprise Plus utiliza un motor de almacenamiento propio, que sustituye a HBase. Características principales:
o   Rendimientos 12x más rápidos y una reducción del 50% del espacio de almacenamiento.

Permite hacer consultas sobre los datos en bruto (sin transformar a un esquema estrella, raw data). Esto facilita la exploración de los datos para el descubrimiento iterativo del modelo.


Comparativa de características de las versiones Enterprise y Enterprise Plus de KAP (Kyligence Analytic Platform) frente a Apache Kylin:


Apache Kylin
KAP
KAP Plus

Posicionamiento
Soporte para OLAP en Hadoop
Data Warehouse en Hadoop
Núcleo
Apache Kylin
Apache Kylin
Apache Kylin
Rendimiento de las consultas
Latencias de consulta inferiores al segundo
En 3 y 40 veces más rápido que Apache Kylin
Parallel Computing
Haciendo uso del Co - procesador de HBase
Spark
Storage Engine
HBase
HBase
KyStorage: Motor de almacenamiento columnar propietario
Raw Data Query
Limitado
Limitado
Soporte Eficiente
Security
Limitado
LDAP/Kerberos/cell level access control
BI Tool
No incluye herramienta de BI native, pero puede conectar con las principales herramientas BI del mercado: Tableu, Microsoft PowerBI, Apache Zeppelin, Saiku Server o Pentaho & STPivot
KyAnalyzer: Herramienta BI con integración nativa
Technical Support
Comunidad Open Source
Soporte 5*8 o 7*24
Soporte5*8 o 7*24
KyBot Self-Service
No incluido, pero se puede comprar por separado
Incluido
Incluido


Pila de productos de Kyligence Analytic Platform

Todos los productos de Kyligence hacen uso del núcleo Open Source de Apache Kylin. Sobre esta base han desarrollado 3 productos.


-          Apache Kylin: Núcleo de Kyligence. Sobre el núcleo añaden las últimas actualizaciones y bug fixes sobre la versión Enterprise.
o   Nota: Kyligence está formado por 6 PMC (Miembros del comité de proyecto) de Apache Kylin Open Source de un total de 13 PMC. De esta forma, muchos de los bug fixes van a llegar antes a KAP que a Kylin.

-  KyStorage & Plugin: Sobre el núcleo de Kylin se añaden las siguientes características
o   Características mejoradas de seguridad. Apache Kylin (Open Source) soporta la integración con LDAP y seguridad a nivel de modelo de dato (a nivel de cubo), añadiéndose las siguientes:
§  Integración con Kerberos
§  Seguridad a nivel de datos (celda)
o   Soporte para consultas OLAP sobre datos en Hive sin transformar (raw data): En Apache Kylin y KAP Enterprise es posible añadiendo subqueries de Hive a las queries principales sobre el cubo.
§  KAP Enterpise Plus: Soporte y eficiencia mejorada para el procesamiento de datos en bruto.

o   Almacenamiento columnar propio (solo en KAP Enterprise Plus): Apache Kylin y KAP Enterprise usan HBase para almacenar el cubo que se construye a partir de los datos en Hive/HDFS.
§  KAP Enterprise Plus utiliza un motor de almacenamiento propio, que sustituye a HBase, prometiendo rendimientos 12x más rápidos y una reducción del 50% del espacio de almacenamiento.

-  KyAnalyzer: Herramienta BI OLAP basada en Saiku Server que integra de forma nativa con KAP Enterprise y KAP Enterprise Plus. Es un Saiku Server personalizado que incluye la versión de Mondrian y el driver JDBC necesarios para la conexión con Kyligence.

-  KyBot: Herramienta de diagnóstico y soporte automatizado incluida en KAP Enterprise y Enterprise Plus. También es posible adquirirla por separado para usarla con Kylin Open Source. Incluye las siguientes características:
o   Cuadro de mando que nos permite analizar de un vistazo:
§  Estado del clúster Kylin
§  Rendimiento
§  Almacenamiento
o   Optimización: El sistema detecta automáticamente los problemas de rendimiento y propone optimizaciones para el diseño del modelo del cubo y el diseño/ejecución de las consultas sobre dicho cubo.
o   Documentación y guía para la resolución de problemas
o   Soporte: Incorpora herramientas para comunicarse con los expertos de Kylin y desarrolladores.


Data Visualization para FIWARE

$
0
0

FIWARE, es una plataforma, impulsada por la Unión Europea, para el desarrollo y despliegue global de aplicaciones de Internet del Futuro. 
FIWARE intenta proveer de una arquitectura totalmente abierta, pública y libre así como de un conjunto de especificaciones que permita a los desarrolladores, proveedores de servicios, empresas y otras organizaciones desarrollar productos que satisfagan sus necesidades, sin dejar de ser abierta e innovadora

Uno de los puntos importantes en esta plataforma es la Visualización de Datos y esta la proporciona la plataforma SpagoBI, de la que somos partners hace años y es Open Source


Ver el Catalogo de Fiware. Como podéis ver, contiene un gran número de componentes

Predictions: A Cynic’s Guide To BI In 2017

$
0
0

Genial esta descripción de Timo Elliot (uno de los mayores especialistas en Business Intelligence). No tiene desperdicio!!

Businesspeople

  • Businesspeople will be dissatisfied with their BI systems (this is “Timo’s First Law of BI”)
  • Executives will refuse to learn to use any other data tool than Excel (and not even the newer features of that).
  • No matter how good the BI system, businesspeople will make bad decisions based on gut feel.
  • Executives will be completely unaware of data quality problems—unless their bonus depends on some value affected by it, at which point they will become experts.
  • Businesspeople will find it hard to articulate what data they need—and then they will change their minds as soon as they get what they asked for.
  • Some businesspeople will get fed up with corporate BI and take it into their own hands. They will build a loosely connected set of different technologies, resulting in huge maintenance costs and low compliance. They will then ask IT to take over the project.

IT

  • IT teams will implement new ERP systems, then be surprised when businesspeople ask for analytics. Providing the analytics will require expensive changes to the ERP system.
  • IT teams will struggle to build business cases for BI. But as soon as the businesspeople have access to the new data, they will change processes, create new opportunities, and save millions. They will take all the credit for this.
  • “Download to Excel” will continue to be the most-requested BI tool feature. Users will complain when they are unable to download the entire corporate data lake to their PC.
  • Data quality, data integration, and metadata will be the primary barriers to BI. But companies will continue to invest less in these areas than in shiny executive dashboards.
  • New data sources will outpace IT’s ability to integrate them into core platforms (no matter what technology is used).
  • BI competency centers will over-invest in technical skills and under-invest in training, communications, and community-building.

Analysts

  • Some analysts will say BI and BI competency centers are dead, much to the confusion of the millions of people doing it every day.
  • Analysts will say that there is only 15% penetration of BI. Nobody will understand where this number comes from and why it hasn’t changed in over twenty years.
  • Analysts will say that data should be treated like an asset. Companies will not treat it like an asset.
  • BI success numbers will be “calculated” using non-scientific samples of self-reported estimates without defining what “success” means. Analysts will say these numbers are too low, and that you need help from analysts to improve them.

The market


  • Everybody will insist their definition of Business Intelligence/Analytics/Big Data, etc. is the only “correct” one.
  • New analytics buzzwords will be coined. Thousands of articles will be written saying that the new buzzwords are meaningless and/or wrong.
  • New BI startups will be created. They will claim to bring “BI to the masses” for the first time.
  • Newer vendors will call the older vendors inflexible dinosaurs. Older vendors will call newer vendors immature and unsafe. Some newer vendors will suddenly realize that they are now considered the older vendors.

Visto en Digitalistmag

Big Data, casos, tecnologias y aplicaciones reales

$
0
0

Os mostramos a continuación, una buena selección de ejemplos, tecnologías y casos aplicables de Big Data usando las principales tecnologías, con enfoque Data Lake, de la mano de los especialistas de stratebi


Open Source Business Intelligence Tips and Tricks in January 2017

$
0
0

Top 50 Business Intelligence Blogs Every BI Decision Maker Must Follow

$
0
0

Tutorial: Curso de Creacion de Dashboards con soluciones Open Source

$
0
0

Cada vez son más demandados los Cuadros de Mando y la buena noticia es que gran parte de ellos pueden hacerse con soluciones Open Source: Pentaho, CDE, dc.js...

Os incluimos las principales claves para construir potentes Cuadros de Mando, del Curso de creación de Dashboards Open Source:


Si os ha interesado, podéis también:

- Ver ejemplos en funcionamiento de Cuadros de Mando Open Source
- Ver Galería de Cuadros de Mando y Video Tutorial de Cuadros de Mando Open Source
- Ver temario y Cursos presenciales e 'in company' para crear cuadros de mando de forma práctica
- Ver Cuadros de Mando con tecnologías Big Data'Real Time?

También podéis ver este Video Tutorial muy práctico:


Es interesante el BI QuickSight de Amazon?

$
0
0

Como ya comentamos cuando se presentó, Amazon, al igual que Google, intenta acaparar todos los mercados, fruto de su alta penetración en muchos sectores y actividades

Ahora llega al Business Intelligence con su plataforma Quicksight. La verdad es que parece interesante al venir de Amazon, por su capacidad en la nube y competitividad en precio. Para los que llevamos tiempo trabajando con Business Intelligence, sabemos de la complejidad de estas soluciones, aunque se pretentan ofrecer como algo sencillo, de ahí que Amazon se apoye mucho en la integración, tanto con soluciones de front-end (todavía no disponible, como Tableau, Qlikview...), como con soluciones de ETL (Integracion de datos - Talend, Informatica...-)

Tiene un claro objetivo de ir 'atrapando' a los clientes dentro de su 'red' de soluciones para crear dependencia. Técnica ya conocida y empleado por Microsoft, Google, Oracle... y todas las grandes compañías con capacidad de crear dependencia

Todavía está en sus comienzos, pero habrá que estar atentos como madura

Os contamos:

What is QuickSight?

Amazon QuickSight is a fast, cloud-powered business analytics service that makes it easy to build visualizations, perform ad-hoc analysis, and quickly get business insights from your data. Using our cloud-based service you can easily connect to your data, perform advanced analysis, and create stunning visualizations and rich dashboards that can be accessed from any browser or mobile device.

Ver en accion:


Bouquet: Open Source Analytics API

$
0
0

Bouquet, is the open source analytics API used by developers for building analytics applications

Bouquet addresses the challenges faced by a developer designing a new analytics visualization. Bouquet includes a powerful Javascript SDK with a D3js component and enforces multiple levels of security to meet the needs of the enterprise.

Bouquet supports SQL-on-Hadoop frameworks such a Pivotal Hawq and Apache Drill, and soon SparkSQL and Presto, along with most relational databases. “Pivotal shares an open source vision of software and Bouquet is a powerful addition to the big data ecosystem.  


Its ease of integration enables the creation of secure, scalable data visualizations on top of the world’s leading Hadoop Native SQL, powered by PivotalHDB ,” said Michael Cucchi, Sr. Director, Big Data Product Marketing at Pivotal

Descargar Bouquet


Tutorial gratuito de Introduccion a Pentaho 2017

$
0
0

Ya tenéis disponible el Curso de Introducción a Pentaho, con más de dos horas y media de duración, actualizado a este 2017, que cubre todos los aspectos para crear potentes soluciones Business Intelligence y Data Warehouse, con gran cantidad de ejemplos prácticos, que esperamos os sea de utilidad

Se hace un repaso a todas las herramientas necesarias para la construcción de estas soluciones, indicando paso a paso como usarlas, así como ejemplos reales de aplicación.


El Tutorial cubre los siguientes apartados:

- ETL

- Metadatos
- Reporting
- Modelos Mondrian
- Analisis OLAP
- Cuadros de Mando
- Scorecards
- Big Data...


(Libro y VideoTutorial) Storytelling with Data: A Data Visualization Guide for Business Professionals

$
0
0

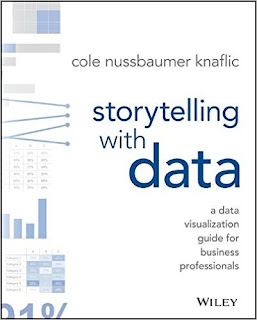
Un libro muy interesante para todos los interesados en Visualización y como 'contar' con datos, colores y formas, muy de moda a través del concepto de 'Storytelling'

Abajo, tenéis también este VideoTutorial explicado por la autora:

Gran Estudio del BBVA sobre Open Source

$
0
0


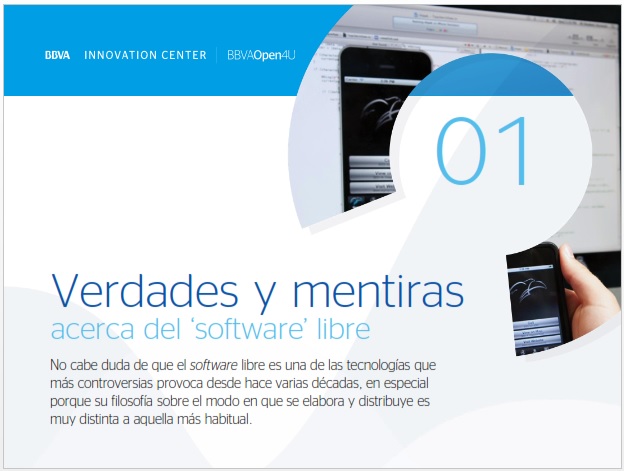
BBVA ha elaborado un estudio (unas 120 páginas) muy interesante sobre Open Source: Historia, Tecnologías, Modelos de Negocio, etc...

Ni dudeis en descargároslo

Empieza interesante...


LinceBI, the best Analytics/BigData open source based solution!!

$
0
0

As powerful as an enterprise version, with the advantages of being Open Source based. Discover LinceBI, the most complete Bussines Intelligence platform including all the functionalities you need


Dashboards
  • User friendly, templates and wizard
  • Technical skills is not mandatory
  • Link to external content
  • Browse and navigate on cascade dependency graphs
Analytic Reporting
  • PC, Tablet, Smartphone compatibility
  • Syncs your analysis with other users
  • Download information on your device
  • Make better decisions anywhere and anytime
Bursting
  • Different output formats (CSV, Excel, PDF, HTML)
  • Task scheduling to automatic execution
  • Mailing
Balance Scorecard
  • Assign customized weights to your kpis
  • Edit your data on fly or upload an excel template
  • Follow your key performance indicators
  • Visual kpis, traffic lights colours
  • Assign color coding to your threshold
  • Define your own key performance indicators
Accessibility
  • Make calculated fields on the fly
  • Explore your data on chart
  • Drill down and roll up capabilities
  • What if analysis and mailing
Adhoc Reporting
  • Build your reports easily, drag and drop
  • Models and languaje created to Business Users
  • Corporative templates to your company
  • Advanced filters
Alerts
  • Configure your threshold
  • Mapping alerts and business rules
  • Planning actions when an event happen
Check FAQs section for any question


    Glosario de Terminos de Business Intelligence

    $
    0
    0

    Para todos aquellos que se están introduciendo en el mundo del Business Intelligence, os incluimos un Glosario de los principales términos de Business Intelligence. Visto en el blog de Panorama

    Si queréis jugar con una Demo abierta, open source, para conocer y probar estos conceptos, es lo mejor para familiarizarse.

    Glosario de Términos Business Intelligence:

    • Automated Analysis: Automatic analysis of data to find hidden insights in the data and show users the answers to questions they have not even thought of yet.
    • BI Analyst: As stated by modernanalyst.com, a data analyst is a professional who is in charge of analyzing and mining data to identify patterns and correlations, mapping and tracing data from system to system in order to solve a problem, using BI and data discovery tools to help business executives in their decision making, and perform statistical analysis of business data, among other things. (Can be called a data analyst too)
    • BI Governance: According to Boris Evelson, from Forrester Research, BI governance is a key part of data governance, but if focuses on a BI system and governs over who uses the data, when, and how.
    • Big Data: Enormous and complex data sets that traditional data processing tools cannot deal with.
    • Bottlenecks: Points of congestion or blockage that hinder the efficiency of the BI system.
    • Business Intelligence: According to Gartner, “Business Intelligence is an umbrella term that includes the applications, infrastructure and tools, and best practices that enable access to and analysis of information to improve and optimize decisions and performance.”
    • Centralized Business Intelligence: A BI model that enables users to work connected and share insights, while seeing the same and only version of the truth. IT governs over data permissions to ensure data security.
    • Collaborative BI: An approach to Business Intelligence where the BI tool empowers users to collaborate between colleagues, share insights, and drive collective knowledge to improve decision making.
    • Collective Knowledge: Knowledge that benefits the whole enterprise as it comes from the sharing of insights and data findings across groups and departments to enrich analysis.
    • Dark Data: According to Gartner, the definition for Dark Data is “information assets that organizations collect, process and store in the course of their regular business activity, but generally fail to use for other purposes”. 90% of companies’ data is dark data.
    • Dashboards: A data visualization tool that displays the current enterprise health, the status of metric and KPIs, and the current data analysis and insights.
    • Data Analyst: As stated by modernanalyst.com, a data analyst is a professional who is in charge of analyzing and mining data to identify patterns and correlations, mapping and tracing data from system to system in order to solve a problem, using BI and data discovery tools to help business executives in their decision making, and perform statistical analysis of business data, among other things.
    • Data Analytics: According to TechTarget, “data analytics is the process of examining data sets in order to draw conclusions about the information they contain, increasingly with the aid of specialized systems and software.”
    • Data Governance: According to Boris Evelson, from Forrester Research, data governance “deals with the entire spectrum (creation, transformation, ownership, etc.) of people, processes, policies, and technologies that manage and govern an enterprise’s use of its data assets (such as data governance stewardship applications, master data management, metadata management, and data quality).
    • Data Mashup: An integration multiple data sets in a unified analytical and visual representation.
    • Data Silos: According to Tech Target, a data silo is “data that is under the control of one department or person and is isolated from the rest of the organization.” Data silos are a bottleneck for effective business operations.
    • Data Sources: The source where the data to be analyzed comes from. It can be a file, a database, a dataset, etc. Modern BI solutions like Necto can mashup data from multiple data sources.
    • Data Visualization: The graphic visualization of data. Can include traditional forms like graphs and charts, and modern forms like infographics.
    • Data Warehouse: A relational database that integrates data from multiple sources within a company.
    • Embedded Analytics: The integration of reporting and data analytic capabilities in a BI solution. Users can access full data analysis capabilities without having to leave their BI platform.
    • Excel Hell: A situation where the enterprise is full of unnecessary copies of data, thousands of spreadsheets get shared, and no one knows with certainty which is the most updated and real version of the data.
    • Federated Business Intelligence: A BI model where users work in separate desktops, creating data silos and unnecessary copies of data, leading to multiple versions of the truth.
    • Geo-analytic capabilities: The ability that a BI or data discovery tool has to analyze data by geographical area and reflect such analysis on maps on the user’s dashboard.
    • Infographics: Visual representations of data that are easily understandable and drive engagement.
    • Insights: According to Forrester Research, insights are “actionable knowledge in the context of a process or decision.”
    • KPI: Key Performance Indicator. A quantifiable measure that a business uses to determine how well it meets the set operational and strategic goals. KPIs give managers insights of what is happening at any specific moment and allow them to see in what direction things are going.
    • Modern BI: An approach to BI using state of the art technology, providing a centralized and secure platform where business users can enjoy self-service capabilities and IT can govern over data security.
    • OLAP: Stands for Online Analytical Processing and it is a technology for data discovery invented by Panorama Software and then sold to Microsoft in 1996. It has many capabilities, such as complex analytics, predictive “what if” scenario planning, and limitless report viewing.
    • Scalability: The ability of a BI solution to be used by a larger number of users as time passes.
    • Self-Service BI: An approach that allows business users to access and work with data sources even though they do not have an analyst or computer science background. They can access, profile, prepare, integrate, curate, model, and enrich data for analysis and consumption by BI platforms. In order to have successful self-service BI, the BI tool must be centralized and governed by IT.
    • Smart Data: Smaller data sets from Big Data that are valuable to the enterprise and can be turned into actionable data.
    • Smart Data Discovery: The processing and analysis of Smart Data to discover insights that can be turned into actions to make data-driven decisions in an organization.
    • Social BI: An approach where social media capabilities, such as social networking, crowdsourcing, and thread-based discussions are embedded into Business Intelligence so that users can communicate and share insights.
    • Social Enterprise: An enterprise that has a new level of corporate connectivity, leveraging the social grid to share and collaborate on information and ideas. It drives a more efficient operation where problems are uncovered and fixed before they can affect the revenue streams.
    • SQL: Stands for Standardized Query Language. It is a language used in programming for managing relational databases and data manipulation.
    • State of the Art BI: The highest level of technology, the most up-to date features, and the best analysis capabilities in a Business Intelligence solution.
    • Suggestive Discovery Engine: An engine behind the program that recommends to the users the most relevant insights to focus on, based on personal preferences and behavior.
    • Systems of Insight: This is a term coined by Boris Evelson, VP of Forrester Research. It is a Business Intelligence system that combines data availability with business agility, where both IT and business users work together to achieve their goals.
    • Workboards: An interactive data visualization tool. It is like a dashboard that displays the current status of KPIs and other data analysis, with the possibility to work directly on it and do further analysis.

    Oferta de empleo Business Analytics (Business Intelligence, Big Data)

    $
    0
    0
    Nuestros compañeros de Stratebi tienen posiciones abiertas para trabajar en el campo del Business Intelligence, Big Data y Social Intelligence en Madrid y Barcelona. Si estás interesado, no dejes de echarle un vistazo y enviarnos tu CV: rrhh@stratebi.com


    Posiciones Abiertas (Febrero 2017):

    Debido a la ampliación de operaciones en Madrid y Barcelona, estamos buscando verdaderos apasionados por el Business Analytics y que hayan tenido interés en soluciones Open Source y en el desarrollo de tecnologías abiertas. Y, sobre todo, con ganas de aprender en nuevas tecnologías como Big Data, Social Intelligence, IoT, etc... 

    Si vienes del mundo frontend, desarrollo de visualizaciones en entornos web, también serás un buen candidato 

    Si estas leyendo estas lineas, seguro que te gusta el Business Intelligence. Estamos buscando a personas con gran interés en este área, que tengan una buena formación técnica y alguna experiencia en la implementación de proyectos Business Intelligence en importantes empresas con (Oracle, MySQL, Powercenter, Business Objects, Pentaho, Microstrategy...) o desarrollos web adhoc. También se valorarán candidaturas sin experiencia profesional en este campo, pero con interés en desarrollar una carrera profesional en este área.


    Mucho mejor, si además fuera con BI Open Source, como Pentaho, Talend... y conocimientos de tecnología Big Data y Social Media, orientado a la visualización y front-end


    Todo ello, será muy útil para la implementación de soluciones BI/DW con la plataforma BI Open Source que está revolucionando el BI: Pentaho, con la que mas trabajamos, junto con el desarrollo de soluciones Big Data, Social Intelligence y Smart Cities

    Si ya conoces, o has trabajado con Pentaho u otras soluciones BI Open Source será un punto a favor. De todos modos, nuestro Plan de Formación te permitirá conocer y mantenerte actualizado en estas soluciones.

    ¿Quieres saber un poco mas sobre nosotros y las características de las personas y perfiles que estamos buscando para 'subirse al barco'?


    ¿Qué ofrecemos?


    - Trabajar en algunas de las áreas de mayor futuro y crecimiento dentro del mundo de la informática: Business Intelligence, Big Data y el Open Source.
    - Colaborar en la mejora de las soluciones Bi Open Source, entre las que se encuentran desarrollando algunas de las empresas tecnológicas más importantes.
    - Entorno de trabajo dinámico, aprendizaje continuo, variedad de retos.
    - Trabajo por objetivos.
    - Considerar el I+D y la innovación como parte principal de nuestros desarrollos.
    - Retribución competitiva.
    - Ser parte de un equipo que valora a las personas y al talento como lo más importante.


    Ya sabes, si te gusta la idea, escribenos, contando tu interés y un CV a:  rrhh@stratebi.com

    O si conoces a alguien, que crees que le podría encajar, no dudes en reenviarselo.


    Detalle de tecnologías que manejamos:

    Conocimientos de Bases de datos:
    - Administracion
    - Desarrollo
    - Oracle, MySql, PostgreSQL, Vertica, Big Data

    - Conocimientos de BI y Datawarehousing con Pentaho u otros BI comerciales (BO, Powercenter, Microstrategy...)
    - Modelado de DataWarehouse
    - ETL
    - Cuadros de mando
    - Reporting, OLAP...

    - Conocimientos de linux
    - Bash scripting
    - Configuracion de servidores y servicios
    - Conocimientos de Java y J2EE
    - Tomcat
    - Jboss
    - Spring
    - Hibernate
    - Ant
    - Git

    Create your own Dashboards in Pentaho

    $
    0
    0


    Just a sneak preview of new functionalities we are including in Pentaho in order end user can create their own powerful dashboards in minutes. We call it STDashboard, by our colleagues of Stratebi.

    These new functionalities include: new templates, panel resize, drag and drop, remove and create panels, Pentaho 7 upgrade...

    As always and as other Pentaho plugins, is free and included in all of our projects. Check the DemoPentaho Online, where all new components are updated frequently

    You can use it too, directly in your own projects, including configuration, training and support with our help


    Video in action (Dashboards in minutes):

    Citus 6.1 Released, escala tu Base de datos PostgreSQL

    $
    0
    0

    Interesantes novedades de Citusdata, ver Community Edition

    Citus es una base de datos distribuida que permite escalar PostgreSQL (una de nuestras Bases de Datos favoritas), permitiendo usar todas las funcionalidades de PostgreSQL con las ventajas de escalar.

    Microservices and NoSQL get a lot of hype, but in many cases what you really want is a relational database that simply works, and can easily scale as your application data grows. Microservices can help you split up areas of concern, but also introduce complexity and often heavy engineering work to migrate to them. Yet, there are a lot of monolithic apps out that do need to scale. 

    If you don’t want the added complexity of microservices, but do need to continue scaling your relational database then you can with Citus. With Citus 6.1 we’re continuing to make scaling out your database even easier with all the benefits of Postgres (SQL, JSONB, PostGIS, indexes, etc.) still packed in there.

    With this new release customers like Heap and Convertflow are able to scale from single node Postgres to horizontal linear scale. Citus 6.1 brings several improvements, making scaling your multi-tenant app even easier. These include:
    • Integrated reference table support
    • Tenant Isolation
    • View support on distributed tables
    • Distributed Vaccum / Analyze

    All of this with the same language bindings, clients, drivers, libraries (like ActiveRecord) that Postgres already works with

    Maps and R

    $
    0
    0

    Leaflet 1.1.0 is now available on CRAN! The Leaflet package is a tidy wrapper for the Leaflet.js mapping library, and makes it incredibly easy to generate interactive maps based on spatial data you have in R.


    Leaflet is one of the most popular open-source JavaScript libraries for interactive maps. It’s used by websites ranging from The New York Times and The Washington Post to GitHub and Flickr, as well as GIS specialists like OpenStreetMap, Mapbox, and CartoDB

    This release was nearly a year in the making, and includes many important new features.
    • Easily add textual labels on markers, polygons, etc., either on hover or statically
    • Highlight polygons, lines, circles, and rectangles on hover
    • Markers can now be configured with a variety of colors and icons, via integration with Leaflet.awesome-markers
    • Built-in support for many types of objects from sf, a new way of representing spatial data in R (all basic sf/sfc/sfg types except MULTIPOINT and GEOMETRYCOLLECTION are directly supported)
    • Projections other than Web Mercator are now supported via Proj4Leaflet
    • Color palette functions now natively support viridis palettes; use "viridis", "magma", "inferno", or "plasma" as the palette argument
    • Discrete color palette functions (colorBin, colorQuantile, and colorFactor) work much better with color brewer palettes
    • Integration with several Leaflet.js utility plugins
    • Data with NA points or zero rows no longer causes errors
    • Support for linked brushing and filtering, via Crosstalk (more about this to come in another blog post)
    Visto en blog.rstudio

    Machine Learning: Choosing the right estimator

    $
    0
    0


    Often the hardest part of solving a machine learning problem can be finding the right estimator for the job.
    Different estimators are better suited for different types of data and different problems.


    The flowchart below by Scikit Learn is designed to give users a bit of a rough guide on how to approach problems with regard to which estimators to try on your data

    Viewing all 866 articles
    Browse latest View live