Quantcast
Channel: Business Intelligence y Big Data: ¡Aprende Gratis sobre Analytics!
Viewing all 866 articles
Browse latest View live

The Big Book of Dashboards

$
0
0

The Big Book of Dashboards presents a comprehensive reference for those tasked with building or overseeing the development of business dashboards

Comprising dozens of examples that address different industries and departments (healthcare, transportation, finance, human resources, marketing, customer service, sports, etc.) and different platforms (print, desktop, tablet, smartphone, and conference room display) 

The Big Book of Dashboards is the only book that matches great dashboards with real-world business scenarios

In TodoBI, with our colleagues of Stratebi, we have created too, several cool online Dashboards samples 


Top 50 Business Intelligence Blogs Winners

$
0
0

Estamos muy contentos de poder contaros que vuestro blog Todobi.com es uno de los 'Top 50 Business Intelligence Blogs Winners'. De hecho es el único blog en español, por lo que el mérito es si cabe aun mayor

Seguiremos dedicando esfuerzo para ampliar y mejorar los contenidos y que os sean de interés

Muchas gracias,

Es interesante Google Data Studio?

$
0
0

Como 'casi' todo lo que toca Google, suele ser de interés. Si no conocéis (en beta todavía) la alternativa de Google para crear Cuadros de Mando, Data Studio, quizás deberías echar un vistazo. 

Eso sí, como en todas la herramientas de Data Discovery, las herramientas no hacen magia (es necesario previamente un buen diseño de modelos, KPIs, ratios, data quality, carga de datos, etc...) y para entornos más grandes y colaborativos, o si quieres customizar o embeber en tus propias aplicaciones, puedes tener limitaciones


Cosas buenas, son la reutilización de templates, por ejemplo y un entorno cómodo para los habituados a Google Analytics, Adwords, etc... (principalmente puede ser útil para los que manejan info principalmente de Google, aunque todos sabemos que los datos están cada vez en más sitios y se necesitan conectores universales)


Google busca competir con Microsoft PowerBI, Tableau, Qliksense y captar a clientes a los que luego ofrecer servicios empresariales. 
Es un buen enfoque, pero el mundo del Business Intelligence, por más que muchos quieran automatizar, para sacar auténtico valor (insights/decisiones), requiere de participación humana de alto valor

DataCleaner 5.2.2 released

$
0
0

Today has been released version 5.2.2 of DataCleaner community edition

En TodoBI os hemos contado bastante sobre DataCleaner (Ver posts con demos)

What is DataCleaner?

Data profiling

The heart of DataCleaner is a strong data profiling engine for discovering and analyzing the quality of your data. Find the patterns, missing values, character sets and other characteristics of your data values.
Profiling is an essential activity of any Data Quality, Master Data Management or Data Governance program. If you don’t know what you’re up against, you have poor chances of fixing it.

Data wrangling

DataCleaner is built to handle data both big and small. Give everything from CSV files, Excel spreadsheets to Relational Databases (RDBMs) and NoSQL databases a spin!

Use reference data, external and internal, in order to verify that the data values you have correspond to the real world.

DataCleaner allows you to build your own cleansing rules and compose them into several use scenarios or target databases. 

Whether it is simple search/replace rules, regular expressions, pattern matching or completely custom transformations, we support it.

Adobe Analytics

$
0
0

Si hace unos días os hablábamos de la iniciativa Analytics de Googe, Google Data Studio, hoy os contamos sobre Adobe Analytics

'Adobe Analytics is an industry–leading solution that empowers you to understand your customers as people — what they want, need, and believe. Discover your most valuable customer segments and use these insights to steer your entire business with customer intelligence'


Tiene 3 planes:

Select

Select
Discover audiences with enterprise-grade analytics.

Empower your decision making with accurate, timely, and insightful data. With drag-and-drop segment building and customizable reporting, you can discover your high-value customers and the best ways to engage them.

Prime

Prime
Multichannel customer intelligence for the enterprise.

Understand your customers, find new insights, and identify issues — all with real-time, multichannel data. Measure the effectiveness of your mobile apps to understand how people interact with your digital experiences across devices.

Ultimate

Ultimate
Advanced machine learning and deep customer intelligence.

Take advantage of machine learning and AI to discover deep insights and uncover hidden opportunities. Use experiential data from cross-channel marketing and advanced analytics to get the most complete picture of your customers' journey.

Anaconda, Python Data Science Platform

Libro gratuito: Ultimate Guide To Data Science Interviews

$
0
0

What’s inside? 
90 pages of original research, interviews with real data scientists and hiring managers at some of the best data science teams on earth, as well as recruiters and successful candidates who are now data scientists, and actionable checklists. We’ll walk you, step-by-step through everything you need to know to ace the data science interview. 
  • You’ll start by understanding the different roles and industries within data science so you can apply for jobs that are the best fit for you.
  • Next, you’ll learn how to apply for these jobs to maximize your chances of getting an interview.
  • Then, you’ll go over every step of the data science interview process so that you can prepare for what’s coming.
  • Next, you’ll get free sample questions that cover the categories of questions you can expect to receive, which you can use to practice how you approach the data science interview.
  • Then, you’ll get advice on what to do after the interview to move the process forward.
  • Finally, you’ll know what to do if you’re juggling between different offers.

Table of Contents:
Introduction
What is Data Science?
Different Roles within Data Science
How Different Companies Think About Data Science:
  1. Early­stage startups (200 employees or fewer) looking to build a data product
  2. Early­stage startups (200 employees or fewer) looking to take advantage of their data
  3. Mid­size and large Fortune 500 companies who are looking to take advantage of their data
  4. Large technology companies with well­ established data teams
Industries that employ Data Scientists
Getting a Data Science Interview
Nine Paths to a Data Science Interview
Traditional Paths to Job Interviews:
  1. Data Science Job Boards and Standard Job Applications
  2. Work with a Recruiter
  3. Go to Job Fairs
Proactive Paths to Job Interviews:
  1. Attend or Organize a Data Science Event
  2. Freelance and Build a Portfolio
  3. Get Involved in Open Data and Open Source
  4. Participate in Data Science Competitions
  5. Ask for Coffees, do Informational Interviews
  6. Attend Data Hackathons
Working with Recruiters
  1. How to Apply
  2. CV vs LinkedIn
  3. Cover Letter vs Email
  4. How to get References and Your Network to Work for You
  5. Preparing for the Interview
What to Expect:
  1. The Phone Screen
  2. Take­home Assignment
  3. Phone Call with a Hiring Manager
  4. On­site Interview with a Hiring Manager
  5. Technical Challenge
  6. Interview with an Executive
What a data scientist is being evaluated on
  1. The Categories of Data Science Questions
  2. Behavioral Questions
  3. Mathematics Questions
  4. Statistics Questions
  5. Scenario Questions
  6. Tackling the Interview
  7. Conclusion
What Hiring Managers are Looking For:
  1. Interview with Will Kurt (Quick Sprout)
  2. Interview with Matt Fornito (OpsVision Solutions)
  3. Interview with Andrew Maguire (PMC/Google/Accenture)
  4. Interview with Hristo Gyoshev (MasterClass)
  5. Conclusion
How Successful Interviewees Made It:
  1. Sara Weinstein
  2. Niraj Sheth
  3. Sdrjan Santic
  4. Conclusion
7 Things to Do After The Interview:
  1. Send a follow­up thank you note
  2. Send them thoughts on something they brought up in the interview
  3. Send relevant work/homework to the employer
  4. Keep in touch, the right way
  5. Leverage connections
  6. Accept any rejection with professionalism
  7. Keep up hope
The Offer Process
  1. Handling Offers
  2. Company Culture
  3. Team
  4. Location
  5. Negotiating Your Salary
  6. Facts and Figures
  7. Taking the Offer to the Best First Day
Templates
  1. Reaching out to get a referral
  2. Following up after an interview

IoT Analytics and Industry 4.0

$
0
0


Cada vez más el uso de Analytics para IoT, alrededor del concepto de Industry 4.0 está suponiendo una revolución en la digitación del sector productivo e industria. El despegue del Big Data, de uso de Analytics y de tecnologías abiertas lo están haciendo posible

El gráfico superior explica muy bien estas posibilidades

En TodoBI hemos hablado bastante de IoT y su explotación con Analytics,
Incluimos algunas de las mejores soluciones open source para su uso 

Big Data Analytics for Financial Services

$
0
0

Un gran evento el de Big Data Analytics for Financial Services

"Due to the sheer volume of data the financial services sector generates from customers, transactions, global trading, and many other sources, it is currently one of the most risk laden sectors.

This has put the FS sector under increased scruitiny from regulatory bodies to remain compliant, resulting in the on-going pressure for effective information governance.

But this has also created an opportunity to improve competiveness and drive business growth. The sector has continued to use data to detect and manage the increase in fraud and financial crime, develop competitive pricing, manage risk & compliance as well as make strategic business decisions. But now, the shift has also moved towards innovation, and data is being leveraged to develop new and personalised products and services via better customer segmentation and analysis"

Descargar Documento


En Tecnologia y Consultoria #StopBodyShopping

$
0
0

Defendamos el trabajo bien hecho y de calidad. Aprender lleva mucho tiempo. No se puede saber de todo

"La sabiduría es hija de la experiencia"
 

Leonardo Da Vinci(1452-1519) Pintor, escultor e inventor

Cual es el nivel de Big Data en tu compañía?

$
0
0
En esta infografía podéis ubicar a vuestra compañía y conocer el nivel de madurez en que se encuentra. Muy últil. 
Para estar actualizado en Big Data, echa un vistazo a la mejor recopilación de posts sobre Big Data que hemos publicado


Quieres trabajar en Big Data/Analytics y tienes ganas de aprender?

$
0
0


Tenemos un plan de formación y carrera para profesionales con una base inicial y muchas ganas de aprender. Escríbenos a rrhh@stratebi.com (Octubre 2017)

Podrás participar en proyectos y en desarrollos con las tecnologías más modernas, como Dashboards en tiempo real


·        Requisitos:
o   Descripción: Una persona con interés en Big Data, no es necesaria mucha experiencia, pero con ganas de aprender y formar equipo. Por ejemplo, i), una persona que acabe de terminar una Ingeniería Informática y/o su trabajo de fin de carrera sea sobre Big Data, ii), una persona que esté haciendo I+D en Big Data  o iii), que haya hecho un máster en Big Data 
o   Salario: Según valía
o   Habilidades:
§  Imprescindibles:
·         Conocimientos teóricos básicos de Big Data.
o   Qué es el Big Data.
o   Debe tener claro el paradigma Map Reduce.
·  Conocimientos teóricos básicos de las siguientes tecnologías de arquitectura Hadoop.
o   HDFS
o   Spark
·         Conocimientos teóricos sobre Machine Learning.
·     Programación en i) Python y ii) Scala o Java para Machine Learning, con mínima experiencia demostrable 
·         Conocimiento de Bases de Datos
o   Soltura con lenguaje SQL.
o   Modelado relacional.
o   Experiencia mínima demostrable en al menos uno de los siguientes SGBD:
§  MySQL
§  PostgreSQL
§  Microsoft SQLServer
§  Oracle
§  Opcionales (alguno de estos conocimientos serían muy interesantes):
·         (+) Conocimientos teóricos básicos de arquitectura Hadoop.
o   Hive
o   HBase
o   Kafka
o   Flume
o   Distribuciones Cloudera o Hortonworks:
§  Características
§  Instalación.
·         Conocimientos teóricos Business Intelligence
o   Teoría de Data Warehouses.
§  Modelado en estrella.
·         Experiencia con alguna herramienta de ETL.
o   Ideal con Pentaho Data Integration o Talend
o   Cualquier otra.
·         Experiencia en diseño y carga de un Data Warehouse.


Microsoft lanza nuevas herramientas de Machine Learning

$
0
0


Microsoft, just like many of its competitors, has gone all in on machine learning. That emphasis is on full display at the company’s Ignite conference this where, where the company today announced a number of new tools for developers who want to build new A.I. models and users who simply want to make use of these pre-existing models — either from their own teams or from Microsoft.

For developers, the company launched three major new tools today: the Azure Machine Learning Experimentation service, the Azure Machine Learning Workbench and the Azure Machine Learning Model Management service.


In addition, Microsoft also launched a new set of tools for developers who want to use its Visual Studio Code IDE for building models with CNTK, TensorFlow, Theano, Keras and Caffe2. And for non-developers, Microsoft is also bringing Azure-based machine learning models to Excel users, who will now be able to call up the AI functions that their company’s data scientists have created right from their spreadsheets.

Visto en Techcrunch

Te puede interesar: Las 53 claves para conocer Machine Learning

The stories behind the data

$
0
0


No dejéis de echar un vistazo a esta iniciativa de Bill Gates: The stories behind the data

"We are launching this report this year and will publish it every year until 2030 because we want to accelerate progress in the fight against poverty by helping to diagnose urgent problems, identify promising solutions, measure and interpret key results, and spread best practices.
As it happens, this report comes out at a time when there is more doubt than usual about the world’s commitment to development."

Google lanza Cloud Dataprep in public beta

$
0
0


Muy interesante esta iniciativa de Google en Cloud, Cloud Dataprep, con la idea de facilitar los procesos ETL. Os dejamos la info más abajo, pero según nuestra opinión, dos temas importantes a considerar:

- Data preparation es un eufemismo para intentar dar a entender que los procesos ETL pueden ser sencillos y para usuarios finales, algo que para cualquiera que se dedique al Analytics sabe que no lo es (de hecho, es la parte más compleja e importante, es como la parte oculta de un iceberg). Y, esto es, por que se vislumbra mercado/ingresos en este área. Ver siguiente punto:

- Tiene un modelo de pricing

Google Cloud Dataprep is an intelligent data service for visually exploring, cleaning, and preparing structured and unstructured data for analysis. Cloud Dataprep is serverless and works at any scale. There is no infrastructure to deploy or manage. Easy data preparation with clicks and no code.


Cuales son las novedades es MySQL 8.0?

$
0
0


MySQL, the popular open-source database that’s a standard element in many web application stacks, has unveiled the first release candidate for version 8.0.
Features to be rolled out in MySQL 8.0 include:
  • First-class support for Unicode 9.0 out of the box.
  • Window functions and recursive SQL syntax, for queries that previously weren’t possible or would have been difficult to write.
  • Expanded support for native JSON data and document-store functionality.
With version 8.0, MySQL is jumping several versions in its numbering (from 5.5), due to 6.0 being nixed and 7.0 being reserved for the clustering version of MySQL.

MySQL 8.0’s expected release date

MySQL hasn’t committed to a release date for MySQL 8.0, by MySQL’s policy is “a new [general] release every 18-24 months.” The last general release was October 21, 2015, for MySQL 5.7, so MySQL 8.0’s production version is likely to come in October 2017

Where to download MySQL 8.0
You can download the beta versions of MySQL 8.0 now for Windows, MacOS, several versions of Linux, FreeBSD, and Solaris; the source code is also available. Scroll down the downloads page and go to the Development Releases tab to get them.

Visto en Infoworld

Pentaho 8 Reporting for Java Developers

$
0
0

Gracias a Packt que nos ha enviado una copia de: 'Pentaho 8 Reporting for Java Developers' para revisión, como hemos hecho en otras ocasiones y que publicaremos proximamente

Este libro está escrito por un buen amigo con el que hemos coincidido en bastantes Pentaho Developers, Francesco Corti. Echad un vistazo a su web, gran experto en Alfresco y su integración con Pentaho.

Más de 400 páginas de utilidad en este libro, con código para ejercicios

Puedes ver también, el tutorial gratuito sobre Pentaho

Open Source Business Intelligence tips in October 2017

$
0
0

Use Case “Dashboard with Kylin (OLAP Hadoop) & Power BI”

$
0
0


In recent posts, we explained how to fill the gap between Big Data and OLAP, using Tableau, Pentaho and Apache Zeppelin.

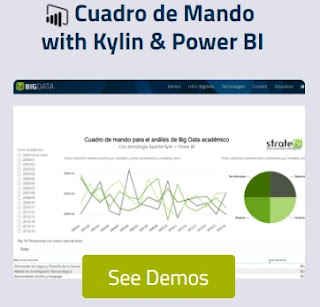
Now, we´ll show you how to use PowerBI for Big Data Dashboards using Apache Kylin. Also try online in our Big Data Demo site


Arquitecture:
In this use case we have used together Apache Kylin and Power BI to support interactive data analysis (OLAP) and developing a dashboard, from data source with Big Data features (Volume, Speed, Variety).


The data source contains the last 15 years of academic data from a big university. Over this data source, we have designed a multidimensional model with the aim of analyze student’s academic performance. We have stored in our Data Warehouse about 100 million rows, with metrics like credits, passed subjects, etc. The analysis of these facts is based on dimensions like gender, qualification, date, time or academic year.
However this data volume is too large to be analyzed using traditional database systems for OLAP interactive analysis. To address this issue, we decide to try Apache Kylin, a new technology that promises sub second interactive queries for data Volumes over billions and trillion of rows on the fact table.
Apache Kylin architecture is based on two Hadoop stack technologies: Apache Hive and HBase. First, we have to implement the Data Warehouse (DW) on Hive database using a star or a snow flake schemas. Once we have implemented one of these data models, we can define an OLAP cube on Kylin. 
To this end, we have also to define a Kylin’s cube model using Kylin’s GUI with wizard. At this moment, Kylin can generate the MOLAP cube in an automatic process. After cube creation, we can query the OLAP cube using SQL queries or connecting to a BI tool using the available J/ODBC connectors.
With aim to explore the data and generate visualizations that allows users to extract useful knowledge from data, we have chosen Microsoft Power BI tools: Power BI Desktop and Power BI Service (free of charge version).
Power BI Desktop is a completely free desktop self-service BI tool that enable users to create professional dashboards easily, dragging and dropping data concepts and charts to a new dashboard. Using this tool we have developed a dashboard, similar to our use cases with Tableau or Apache Zeppelin.
Once designed the dashboard, we have published it on the Web with Power BI cloud service (free edition). In other to do that, we have to create an extract of the data and upload it with the dashboard.  This process is transparent to users, who also can program data refreshing frequency using Pro or Premium versions of the Power BI service (commercial tools).


Apache Kylin:


Developed by eBay and later released as Apache Open Source Project, Kylin is an open source analytical middle ware that supports the support analysis OLAP of big volumes of information with Big Data charactertistics, (Volume, Speed, and Variety).
But nevertheless, until Kylin appeared in the market, OLAP technologies was limited to Relational Databases, or in some cases optimized for multidimensional storage, with serious limitations on Big Data.
Apache Kylin, builded on top of many technologies of Hadoop environment, offer an SQL interface that allows querying data set for multidimensional analysis, achieving response time of a few seconds, over 10 millios rows.
There are keys technologies for Kylin; Apache Hive and Apache HBase
The Data Warehouse is based on a Start Model stored on Apache Hive. 
Using this model and a definition of a meta-data model, Kylin builds a multidimensional MOLAP Cube in HBase. 
After the cube is builded the users can query it, using an SQL based language with its JDBC driver.
When Kylin receives an SQL query, decide if it can be resolved using the MOLAP cube in HBase (in milliseconds), or not, in this case Kylin build its own query and execute it in the Apache Hive Storage, this case is rarely used.
As Kylin has a JDBC driver, we can connect it, to most popular BI tools, like Tableau, or any framework that uses JDBC.

PowerBI:


Power BI is a set of Business Intelligence (BI) tools created by Microsoft. Due to its simplicity and powerful, this emerging tools are becoming a leader BI technology like others such as Tableau, Pentaho or Microstrategy. 
Like these technologies, Power BI is a self-service BI tool, extremely simple but with a lot of powerful features as the following: dashboard developing (called reports in Power BI), web and intra organization sharing and collaborative work, including dozens of powerful charts (ej. line chart with forecasting on page 2 of our demo), connection to relational and Big Data sources, support for natural language Q & A, support to execute and visualize R statistic programs or data preprocessing (ETL).
The above features are implemented across the different tools of Power BI suite. Power BI desktop is a desktop tool for data discovery, transformation and visualization. It is a completely free tool with connectors to the most used relational and Big Data sources. Although for same data sources there are specific connectors, with Apache Kylin we have to use the ODBC connector available on Apache Kylin web page. In this way, we connect to Kylin and a data extract from data source is automatically generated by Power BI. 
At this moment we can create our demo visualization as follows: i) define data model, ii), apply some data transformations if needed (e.g. date format), iii) generate calculated metrics (e.g. student success rate), and then, iv), create the dashboard visualization, with one or multiple pages (e.g. our demo has two page interchangeable with bottom bar selector).
At this time, we have used Power BI service (cloud) to publish on the web our new dashboard join with data extract. To this end, we created an account of Power BI free. In this case, there are also Pro and Premium commercial editions with additional features like data extraction automatic refreshing and direct connections to some data sources such as SQL Server (also Analysis Services), Oracle or Cloudera Impala. 
However none of these direct connectors are for Apache Kylin, then with Kylin we have to use data extraction and data extract refreshing approaches.  
In addition to Power BI Desktop and Power BI Services (Free, Pro and Premium) there are other Power BI tools such as Power BI Mobile (access to dashboard from smartphone and collaborative work) or Power BI Embedded (to use visualizations in ad-hoc apps, web portals, etc).

If you are interested to implement your BI company project with Power BI do not hesitate to contact us on StrateBI.


Comparativa de Costes Tableau vs PowerBI

$
0
0
 

Os dejamos un documento listo para descargar, con una comparativa muy completa de costes entre Tableau y PowerBI (hay que decir que el informe ha sido encargado por Tableau, por lo que puede tener cierto sesgo). 

Por ejemplo, en cuanto al esfuerzo de este tipo de proyectos, si tenemos en cuenta que ambas son herramientas de Data Discovery (usuario final), no se tiene suficientemente en cuenta la parte más importante, el modelado, ETL, Data Quality, etc... 

En la práctica, estas herramientas, necesitan también de herramientas ETL, metadatos, MDM, Data Quality que garanticen la correcta implementación en entornos en producción

Para una comparativa de funcionalidades técnicas echad un vistazo a la Comparativa de herramientas Business Intelligence

Ver también: Como preparar un entorno Big Data OLAP con Tableau y con PowerBI


Viewing all 866 articles
Browse latest View live