Human Resources LinceBI Analyticssolution is based on open source including KPIs, Reports, OLAP Analysis, Dashboards, Scorecards, Big Data and Machine Learning with 'predefined templates, dashboards and KPIs/ratios and fully customizable environment
Manage budgets efficiently and maximize revenues and costs in favour of collective benefit.
Do more with less! Through innovative techniques of Data Mining and Social Intelligence to maximize objectives, identifying trends related to workers behavior and satisfaction in order to answer their demands efficiently and improve engagement
The table of contents will give you a summary of all countries represented on this list. Simply click on a country’s name and the page will bring you to the correct section. If you are curious about how we created this list, an article about it, thanks to OpenDataSoft
Que duda cabe, que el surgimiento de iniciativas tecnológicas alrededor del campo de las finanzas, Fintech, en España, puede considerarse una buena noticia. No obstante, viendo experiencias pasadas de burbujas 2.0 y anteriores en el año 2.000, hay que se cautos; para separar el grano de la paja. De una bonita idea, logo, oficinas, etc... a su aplicación práctica con retorno de la inversión, puede distar mucho En cualquier caso, la lista esta disponible, :-)
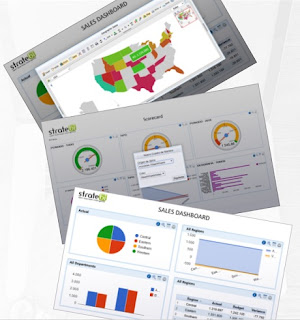
The improvements in this version of STDashboard are focused on user interface for panel and dashboard and also some enhancement in performance and close some old bugs. It works with Pentaho versions 5, 6 and 7 You can see it in action in this Pentaho Demo Online
About UI improvements: - New set of predefined dashboard templates. We have designed a new way to manage dashboard panels that allow you to shape the dashboard in almost any combination of size, proportion and amount of panel you want to have. For this reason we have created a set of different layouts for most common cases.
- Self managed panel. Add and remove panels, now in stdashboard you can add or remove panels easily using the button inside each panel header.
- New layout management. Now an stashboard layout is composed of a list panel container, the containers in this list are stacked vertically in the page. There are two types of such containers; horizontal and vertical, each one stores a list of real panels (the ones where the graph are drawn) in an horizontal or vertical flow, in this ways you can combine those panels to achieve almost any layout you can imagine.
- Resizable panels. We have included the possibility of resize the panel horizontally or vertically, keeping the proportion of graph inside it in correspondence with horizontal adjacent panels without making an horizontal scroll in the page, that means if you shrink a panel horizontally and there is another panel in the same row, the other panels also shrink an a proportional way to allow all panels in a row fit the horizontal size of the window. Is interesting to note here that we have implemented this functionality using pure GWT API, to avoid external dependencies and ensure portability between browsers. - Draggable panels. Each panel in the entire dashboard can be dragged to any parent container. In the header of each single panel the is a handle that allow dragging the panels to any panel container in the dashboard.
- Responsive Dashboard. The ability to resize dynamically the panels and graph when the window's dimensions change, or when a user make zoom in the page is now implemented, also in most phones the dashboard can be seen proportionally and keeping the original layout. - Persistent state of the layout. When you save a dashboard to a file, we are saving the visual state of it and store it in the file. Then, when you open the dashboard, all the details of visual interface are hold and you can see the dashboard exactly the same previous to saved, that means panels size, locations are restored effectively.
About performance: - In some points of the application an specific query was causing performance problem. To know if a member has child or not in a multilevel hierarchy, the previous code issued a query to list all the sons of that member and check if the size is greater than 0, our solutions in this case for this type of query was simply check the level of the current member and in this way answer that boolean query. - Connection to cubes using the new MondrianOlap4jDriver java class. This improve the connection performance and stability because is designed for mondrian connections, the previous code was using an standard JDBC connection.
About new enhacements: - Date configuration for filters. Date dimension are special dimensions, because almost any cube has at least one defined and are very used for make range query over fact table, to allow dynamic filter in panels, we had to enable a .property file that allow the user to define their date dimension and configure the way they want to use it in queries.
- Added the Pentaho File Explorer to allows the users navigation through the files stored in pentaho, like reports, documents, etc and embeed it inside a panel in the dashboard
Que duda cabe, como indicábamos hace unos días en la comparativa entre Tableau y PowerBI que uno de los elementos que se achaca como carencia a Tableau es la ausencia de herramienta de ETL. Lo cierto es que lleva bastante tiempo anunciando su propia herramienta ETL, Project Maestro, más de un año, aunque por lo que conocemos, se asemejaría más a un módulo de Data Preparation orientado a usuario final que una herramienta ETL completa. En nuestra opinión y práctica diaria, buena parte de compañías que usan Tableau y PowerBI, que tienen necesidades de ETL importantes, se decantan por el uso de Pentaho Data Integration y Talend Open Studio, para orquestar todos sus procesos En cualquier caso, la iniciativa de Tableau es interesante para aquellas compañías/usuarios que no tengan necesidades importantes en cuanto a ETL y quieran hacerlas ellos mismos directamente
La cuestión... es que hay que seguir esperando... de momento
Os presentamos un más que interesante Workshop gratuito de Pentaho en Lima, Perú. Será realizado por los especialistas de Stratebi
PUBLICO OBJETIVO
Para todos los que se quieran dedicar al mundo del Business Intelligence, profesionales de las tecnologías de información, gestores de TI, consultores en Business Intelligence, Analistas de Negocio, Analistas de sistemas, arquitectos Java, desarrolladores de sistemas, administradores de bases de datos, desarrolladores y profesionales con relación a el área de tecnología, marketing, negocio y financiera.
Si desean inscribirse o formación 'online completa', adaptada a sus necesidades, pueden contactar con info@stratebi.com
OBJETIVO
El objetivo es enseñar al alumno las posibilidades para construir una solución de Business Intelligence (BI) para hacer el análisis de datos procedentes de diversas fuentes y sistemas, utilizando herramientas de software libre como Pentaho. Herramienta líder en el mercado Open Source.
También se hablará sobre otros entornos BI Open Source como Saiku, Ctools, Talend y otras soluciones desarrolladas por la comunidad.
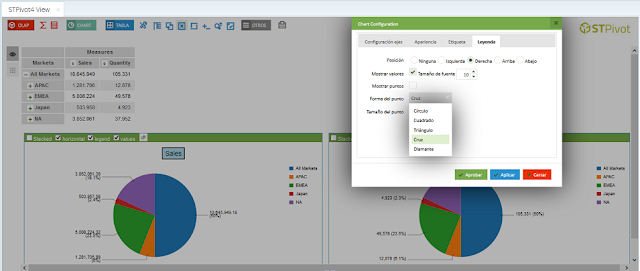
Hi, Pentaho Community fans, just sent a week ago pull request to Pentaho Marketplace in order to upload STPivot4 Olap Viewer, so you have compile it and ready-to-use Just waiting for Pentaho folks in order to be updated Pentaho Marketplace
STPivot4 is based on the old Pivot4J project where functionality has been added, improved and extended. These technical features are mentioned below.
Si hace unos días, os dejábamos disponibles la charla de los Open Spaces sobre Real Time Big Data con Apache Storm, hoy tenéis el video y la presentación del más que interesante de Cassandra, pieza fundamental en gran parte de los proyectos y desarrollos Big Data Analytics. También se realiza una breve introducción al ecosistema NoSQL. Siempre con el foco en su implementación real en proyectos y su vertiente analítica
Si os es útil y os gusta, no dejéis de darnos feedback para continuar con nuevos materiales
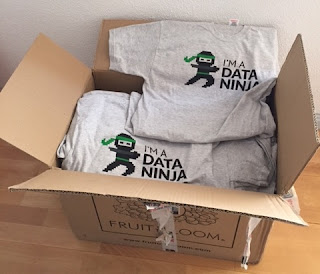
Our colleagues from Stratebi have made us a very cool gift. Some t-shirts for fans of Analytics: Data Ninja, Dashboards Samurai, Data Mining Jedi, and Big Data Hulk Hope to share them with all our course students
En este año 2017, hemos llegado a la edición número 10 del evento más importante para los desarrolladores y comunidad de Pentaho y como todos los años, pasamos a haceros un resumen de lo más interesante. Agradecer al equipo de IT-Novum y la comunidad de Pentaho (Pedro Alves), su gran trabajo en la organización Por nuestra parte, nuestro granito de arena a la comunidad es STPivot4, que ya se ha hecho el 'pull request' para que esté disponible en Pentaho Marketplace Keynotes: Stefan Mueller, el gran organizador, abriendo el evento
10:00 AM - 10:30 AM:All about Pentaho 8.0, Pedro Alves | Senior Vice President Community at Pentaho
Siempre, la presentación más esperada
10:30 AM - 11:00 AM: What’s new in PDI 8.0?, Jens Bleuel | Sr. Product Manager Data Integration at Pentaho
11:00 AM - 11:30 AM: What’s brewing in the Pentaho Labs?, Matt Casters | Chief Architect, PDI Kettle Project Founder at Pentaho
11:30 AM - 11:50 AM: Introducing Pentaho on the Hitachi Vantara Community , Jill Ross | Enterprise Community Manager Hitachi Vantara
Data detectives would investigate organizational data across a company, generating meaningful business answers and recommendations based on examining information generated by Internet of Things (IoT) endpoints, devices, sensors, biometric monitors, traditional computing infrastructure, and next-gen fog, mesh, edge, and neural capabilities.
2. Bring your own IT facilitator
Someone in this position would be responsible for fusing an organization's shadow IT operations with its digital workplace strategy. This facilitator would create a system for visibility into on- and off-premises environments, mobile and desktop systems, and applications and services consumed by corporate users to mitigate risks.
3. Ethical sourcing officer
An ethical sourcing officer would lead an ethics team, and ensure that the allocation of corporate incomes aligns with the standards set by customers and employees. This person would also investigate, track, negotiate, and forge agreements around the automated provisioning of goods and services, to ensure ethical agreement with stakeholders.
4. Artificial intelligence business development manager
An AI business development manager would work to sell AI products to customers. This professional would work with sales, marketing, and partner teams to develop and deploy targeted AI sales and business development activities.
5. Master of edge computing
The master of edge computing would define a company's IoT roadmap, carefully evaluate the technical requirements needed, and assess the feasibility for establishing the edge processing unit and measure the return on investments.
6. Walker/talker
A walker/talker would act as a conversational companion to elderly people, connecting with seniors through a platform similar to Uber.
7. Fitness commitment counselor
This individual would remotely provide one-on-one regular coaching and counseling sessions to improve wellness for participants, and track their progress via wearables.
8. AI-assisted healthcare technician
In this role, a person would be on the road and in surgery to examine, diagnose, administer and prescribe appropriate treatment to patients, aided by the latest AI technology and remotely accessible doctors.
9. Cyber city analyst
A cyber city analyst would ensure the safety, security, and functionality of a city, by ensuring a steady flow of data and keeping all technical equipment functioning.
10. Genomic portfolio director
This individual would be a business executive with a strong commercial background, who can shape the future growth of a company's biotechnology research and ensure that new product offerings fit customers' ongoing health requirements.
11. Man-machine teaming manager
As humans and robots increasingly collaborate, a man-machine teaming manager would help combine the strengths of each to meet business goals.
12. Financial wellness coach
A financial wellness coach could offer banking customers coaching to understand digital banking options and improve their financial health.
13. Digital tailor
Digital tailors would go to retail customers' homes to perfect the fit and finish of their e-commerce-ordered clothes.
14. Chief trust officer
This professional would work alongside finance and PR teams to advise on traditional and cryptocurrency trading practices to maintain integrity and brand reputation.
15. Quantum machine learning analyst
Quantum machine learning analysts would research and develop innovative solutions by applying quantum technologies to improve the speed and performance of machine learning algorithms, and address real-world business problems in the fastest time possible.
16. Virtual store sherpa
A virtual store sherpa would assist customers with their online shopping, to help them better find the product that will meet their needs.
17. Personal data broker
These individuals would execute data trades on behalf of clients, and track new ways of maximizing a client's return on data.
18. Personal memory curator
A personal memory curator would create seamless virtual environments for elderly customers to inhabit. This person would consult with patients and stakeholders to generate specifications for virtual reality experiences that bring a particular time, place, or event to life to combat memory loss.
19. Augmented reality journey builder
AR journey builders would design, write, create, calibrate, gamify, and personalize the next generation of AR experiences.
20. Highway controller
This professional would act as a full-time space controller to regulate road and airspace in a large city by monitoring and programming AI platforms used for space management of autonomous cars and drones.
21. Genetic diversity officer
Beyond racial or gender diversity, a genetic diversity officer would work closely with business unit heads to ensure genetic inclusion within an organization.
Queréis sentiros como un 'big brother y controlar todo lo que se escucha en las radios del mundo? Radio.Garden
How it works?
It's quite simple. This technology is called streaming audio. For example, “SHOUTCAST” is an internet broadcasting tool, used for audio streaming. It can be used by radio stations to bring audio to an internet audience. It uses the very popular mp3 technology for audio delivery. The station broadcasts through the internet instead of broadcasting through radio waves. It is powerful and stable. There is no need for any complicated or expensive software or hardware at the receiving end either - a simple desktop PC and broadband connection will work fine.
RADIO GARDEN is the brainchild of Jonathan Puckey, who is based in Netherlands and is the main person behind this project. The main idea is to help radio makers and listeners connect with distant cultures and/or re-connect with home thousands of miles away. Radio Stations who are willing to be heard on RADIO GARDEN simply register with the webmaster who then pinpoints the location of the station on the world map and provides a hyperlink to the URL of the station. The DJ sends audio data from the station's computer to a central SHOUTcast server that then turns around and streams it out to all connected listeners. I believe, so far more than 10,000 stations have registered. Radio Garden is funded with public money from the Netherlands Institute of Sound and Vision; there is no commercial aspect to the project right now.
Listening to big radio stations is passe. I often listen to CKLB 101.9 MHz FM - one of the six FM stations in Yellowknife - the only city as well as the largest community in the Northwest Territories of Canada with a population of about 19,000. On the map, I do not see any other station for thousands of miles around. Talk about remoteness. Great music, too. Do give it a try - you will be pleasantly surprised!
Now, you can access from the website ohmydata.org to Ashley Madison files revealed using Business Intelligence Open Source tools like Pentaho, Mondrian, STPivot, Saiku, d3.js... You can find predefined reports, analysis and dashboards or you can create your own, slicing by sex, age, country, city, sexual orientation, ethnicity, drink and smoke habits, height, weight and more Hope you like!!
Muy interesante este reciente white paper (no es muy extenso la verdad), cuyo punto más interesante es que está sponsorizado por SAS. Si, por SAS Al igual que hizo Microsoft hace unos años, fabricantes tradicionales se están viendo superados por la irrupción del Open Source: R, sin ir más lejos y están tratando de ubicarse En uno de los puntos de la tabla de contenidos se habla del interesante enfoque de 'como pueden convivir el software comercial y el open source', que también habría podido ser; 'Cómo puede sobrevivir el software comercial'
NUMBER ONE Understand open source analytics tools
NUMBER TWO Consider open source analytics opportunities
NUMBER THREE Be mindful of open source analytics challenges
NUMBER FOUR Think about the business use case
NUMBER FIVE Consider using open source and commercial products together
Ya podéis bajaros el libro de 'La Gacela de Wirayut' para leer en vuestro tablet preferido de forma gratuita, en formato pdf. A todos los que habéis trabajado, trabajais en el mundo de la consultoría, o habéis tratado con consultores, seguro que hay muchas cosas que os resultan familiares.
Se da un repaso a la inutilidad de muchas reuniones de trabajo, la relación con los jefes, el uso del e-mail y de internet, la hipocresía en muchas empresas.
Un apasionante viaje a las profundidades de las empresas. Lugares en donde pasamos gran parte de nuestra vida sin comprender realmente que hacemos allí. Esperemos que os guste y además gratis!!
¿Te llevas bien con tu jefe o solo disimulas?, ¿Utilizas Internet para temas relacionados con tu trabajo o con tu ocio?, ¿Alguna vez has trabajado en el extranjero sin saber apenas inglés?
0. Introducción. La Gacela de Wirayut 1. De moquetas y despachos 2. Tienes un e-mail 3. Haciendo amigos (seguridad, limpieza, mantenimiento) 4. Que bien.... reunión 5. Trabajar en el extranjero (Como Tarzán en Sarajevo) 6. En tierra extraña (cuando se llega a una empresa ‘cliente’) 7. El Alien ‘ado’ 8. Reuniones anuales, Kick-offs 9. ¿Un coffee y hablamos? 10. Internet... no se puede estar sin él 11. Momento Rocky Balboa
Muy interesante infografía sobre la mejor forma de utilizar los gráficos en los Dashboards de PowerBI que, evidentemente, valen para todo tipo de Dashboards
Os presentamos un Estudio muy completo de unas 300 páginas que han realizado nuestros compañeros especialistas en Business Intelligence, Stratebi, con una comparativa y análisis detallados de algunas de las herramientas Business Intelligence que más aceptación están teniendo ultimamente: - PowerBI - Tableau - Qlikview - Pentaho - SAS - Information Builders - Amazon Quicksight Un estudio muy completo para todos los interesados en implementar una solución business intelligence
Now you can check latest tips on Business Intelligence Open Source, in December 2017. You can see some of this tips implemented in Demo Online. This month with great stuff: