Quantcast
Channel: Business Intelligence y Big Data: ¡Aprende Gratis sobre Analytics!
Viewing all 866 articles
Browse latest View live

Big Data, casos, tecnologias y aplicaciones reales

$
0
0

Os mostramos a continuación, una buena selección de ejemplos, tecnologías y casos aplicables de Big Data usando las principales tecnologías, con enfoque Data Lake, de la mano de los especialistas de stratebi


Guia para Bases de Datos NoSQL

$
0
0


Muy interesante este articulo de Felix Gessert, donde nos ofrece una visión actualizada del paisaje actual de las Bases de Datos NoSQL y su aplicación según necesidades. Muy, muy recomendable!!

Os incluimos también una breve introducción en español al ecosistema NoSQL, que hicieron nuestros amigos de Stratebi. Siempre con el foco en su implementación real en proyectos y su vertiente analítica. Demos Big Data Online


Si os es útil y os gusta, no dejéis de darnos feedback para continuar con nuevos materiales


Los 30 mejores proyectos de Machine Learning Open Source

$
0
0


Como sabéis, el Machine Learning es uno de los temas que más nos interesan en el Portal y, máxime, cuando gran parte de las tecnologías son Open Source. En esta entrada, os indicamos los 30 proyectos más interesantes en en este año.

Os dejamos también el material que publicamos con las claves del Machine Learning y una introducción

Ver también, VideoTutorial


No 1

FastText: Library for fast text representation and classification. [11786 stars on Github]. Courtesy of Facebook Research


……….. [ Muse: Multilingual Unsupervised or Supervised word Embeddings, based on Fast Text. 695 stars on Github]

No 2

Deep-photo-styletransfer: Code and data for paper “Deep Photo Style Transfer” [9747 stars on Github]. Courtesy of Fujun Luan, Ph.D. at Cornell University


No 3

The world’s simplest facial recognition api for Python and the command line [8672 stars on Github]. Courtesy of Adam Geitgey


No 4

Magenta: Music and Art Generation with Machine Intelligence [8113 stars on Github].


No 5

Sonnet: TensorFlow-based neural network library [5731 stars on Github]. Courtesy of Malcolm Reynolds at Deepmind


No 6

deeplearn.js: A hardware-accelerated machine intelligence library for the web [5462 stars on Github]. Courtesy of Nikhil Thorat at Google Brain


No 7

Fast Style Transfer in TensorFlow [4843 stars on Github]. Courtesy of Logan Engstrom at MIT


No 8

Pysc2: StarCraft II Learning Environment [3683 stars on Github]. Courtesy of Timo Ewalds at DeepMind


No 9

AirSim: Open source simulator based on Unreal Engine for autonomous vehicles from Microsoft AI & Research [3861 stars on Github]. Courtesy of Shital Shah at Microsoft


No 10

Facets: Visualizations for machine learning datasets [3371 stars on Github]. Courtesy of Google Brain


No 11

Style2Paints: AI colorization of images [3310 stars on Github].


No 12

Tensor2Tensor: A library for generalized sequence to sequence models — Google Research [3087 stars on Github]. Courtesy of Ryan Sepassi at Google Brain


No 13

Image-to-image translation in PyTorch (e.g. horse2zebra, edges2cats, and more) [2847 stars on Github]. Courtesy of Jun-Yan Zhu, Ph.D at Berkeley


No 14

Faiss: A library for efficient similarity search and clustering of dense vectors. [2629 stars on Github]. Courtesy of Facebook Research


No 15

Fashion-mnist: A MNIST-like fashion product database [2780 stars on Github]. Courtesy of Han Xiao, Research Scientist Zalando Tech


No 16

ParlAI: A framework for training and evaluating AI models on a variety of openly available dialog datasets [2578 stars on Github]. Courtesy of Alexander Miller at Facebook Research


No 17

Fairseq: Facebook AI Research Sequence-to-Sequence Toolkit [2571 stars on Github].


No 18

Pyro: Deep universal probabilistic programming with Python and PyTorch [2387 stars on Github]. Courtesy of Uber AI Labs


No 19

iGAN: Interactive Image Generation powered by GAN [2369 stars on Github].


No 20

Deep-image-prior: Image restoration with neural networks but without learning [2188 stars on Github]. Courtesy of Dmitry Ulyanov, Ph.D at Skoltech


No 21

Face_classification: Real-time face detection and emotion/gender classification using fer2013/imdb datasets with a keras CNN model and openCV. [1967 stars on Github].


No 22

Speech-to-Text-WaveNet : End-to-end sentence level English speech recognition using DeepMind’s WaveNet and tensorflow [1961 stars on Github]. Courtesy of Namju Kim at Kakao Brain


No 23

StarGAN: Unified Generative Adversarial Networks for Multi-Domain Image-to-Image Translation [1954 stars on Github]. Courtesy of Yunjey Choi at Korea University


No 24

Ml-agents: Unity Machine Learning Agents [1658 stars on Github]. Courtesy of Arthur Juliani, Deep Learning at Unity3D


No 25

DeepVideoAnalytics: A distributed visual search and visual data analytics platform [1494 stars on Github]. Courtesy of Akshay Bhat, Ph.D at Cornell University


No 26

OpenNMT: Open-Source Neural Machine Translation in Torch [1490 stars on Github].


No 27

Pix2pixHD: Synthesizing and manipulating 2048x1024 images with conditional GANs [1283 stars on Github]. Courtesy of Ming-Yu Liu at AI Research Scientist at Nvidia


No 28

Horovod: Distributed training framework for TensorFlow. [1188 stars on Github]. Courtesy of Uber Engineering


No 29

AI-Blocks: A powerful and intuitive WYSIWYG interface that allows anyone to create Machine Learning models [899 stars on Github].


No 30

Deep neural networks for voice conversion (voice style transfer) in Tensorflow [845 stars on Github]. Courtesy of Dabi Ahn, AI Research at Kakao Brain


Visto en: Medium.mybridge.com

6 motivos para llevar tu BI a la nube y 1 por el que no

$
0
0

De todos es sabido que una de las principales tendencias en estos últimos años es que muchos sistemas Business Intelligence se están llevando a la nube. Pero, también es cierto, que los sistemas que se están llevando a la nube no siempre son para áreas críticas de negocio o que manejen datos sensibles.

Esto limita las posibilidades para llevar tu Business Intelligence al cloud o tener un BI Corporativo con las ventajas de ambos modelos.

Os vamos a contar 6 motivos por los que puedes llevar tu BI a la nube y uno por el que no:

1. Reducción de Costes
Si te adaptas a las características de las soluciones BI que te proponen muchas empresas, con los límites, niveles premium, etc... puedes conseguir unos precios mensuales/anuales muy buenos por usuario

2. Aumentar los recursos, según se necesiten
En negocios y sectores en los que puedes tener variaciones en las concurrencias de uso muy altas, incrementos de volumenes de datos en determinados periodos, análisis real-time puntuales, etc... la posibilidad de asignar más recursos de forma fléxible es una gran ventaja


3. Desarrollos más ágiles
El no tener que depender de las áreas de sistemas, o de la disponibilidad de hardware en tiempo y capacidad de forma adecuada, hace que los desarrollos de proyectos e implementación se puedan demorar en gran manera


4. Entornos compatibles
Llevar tu BI a la nube te puede permitir tener algunos componentes y conectores desplegados de forma nativa, referentes a redes sociales, machine learning, bases de datos, etc...


5. Seguridad y Disponibilidad
Aunque no tener los datos en tus propias máquinas puede darte qué pensar, lo cierto, es que muchas compañías, para gran cantidad de información tienen más seguridad de no perderla o de tener brechas si confían en un entorno en la nube que en sus organizaciones internas, de las que no confían tanto

6. Acceso desde cualquier lugar y momento
Cada vez más, desde que se produjo la democratización del Business Intelligence y más usuarios, analistas, etc... hacen uso de los sistemas BI desde todo tipo de redes, accesos, dispositivos móviles... los entornos en la nube pueden garantizar un acceso común y similar para cada uno de ellos


Y por qué no mover a la nube?

Todas esas ventajas tienen el inconveniente de que si quieres desplegar el BI 'on premise', en tus propios entornos, controlando los datos sensibles y accesos, te topas con que el coste de las correspondientes licencias se dispara hasta niveles increíbles. 
Es el 'peaje' a pagar, por salirte del camino marcado en la nube por los grandes proveedores.

Salvo que.... y esa es la gran ventaja del modelo open source o sin coste de licencias, que se está extendiendo, que puedas desplegarlo 'on premise' o en una 'nube privada', controlada por tí, con todas las ventajas anteriores, más la de ahorro de costes.

Confía en las soluciones BI Open Source o sin coste de licencias y que tener tu BI en la nube o 'on premise' no sea un problema

Apple release 'Turi Create' Machine Learning Framework on Github

$
0
0


Apple says Turi Create is easy to use, has a visual focus, is fast and scalable, and is flexible. Turi Create is designed to export models to Core ML for use in iOS, macOS, watchOS, and tvOS apps. From the Turi Create Github repository: 
  • Easy-to-use: Focus on tasks instead of algorithms
  • Visual: Built-in, streaming visualizations to explore your data
  • Flexible: Supports text, images, audio, video and sensor data
  • Fast and Scalable: Work with large datasets on a single machine
  • Ready To Deploy: Export models to Core ML for use in iOS, macOS, watchOS, and tvOS apps
With Turi Create, for example, developers can quickly build a feature that allows their app to recognize specific objects in images. Doing so takes just a few lines of code.

With Turi Create, you can tackle a number of common scenarios:
You can also work with essential machine learning models, organized into algorithm-based toolkits:

Supported Platforms

Turi Create supports:
  • macOS 10.12+
  • Linux (with glibc 2.12+)
  • Windows 10 (via WSL)

System Requirements


  • Python 2.7 (Python 3.5+ support coming soon)
  • x86_64 architecture

Marketing Analytics, Open Source based Solution

$
0
0

As powerful as an enterprise version, with the advantages of being Open Source based. Discover LinceBI, the most complete Bussines Intelligence platform including all the functionalities you need for Marketing


Dashboards
  • User friendly, templates and wizard
  • Technical skills is not mandatory
  • Link to external content
  • Browse and navigate on cascade dependency graphs


Analytic Reporting
  • PC, Tablet, Smartphone compatibility
  • Syncs your analysis with other users
  • Download information on your device
  • Make better decisions anywhere and anytime

Bursting
  • Different output formats (CSV, Excel, PDF, HTML)
  • Task scheduling to automatic execution
  • Mailing
Balance Scorecard
  • Assign customized weights to your kpis
  • Edit your data on fly or upload an excel template
  • Follow your key performance indicators
  • Visual kpis, traffic lights colours
  • Assign color coding to your threshold
  • Define your own key performance indicators
Accessibility
  • Make calculated fields on the fly
  • Explore your data on chart
  • Drill down and roll up capabilities
  • What if analysis and mailing

Adhoc Reporting
  • Build your reports easily, drag and drop
  • Models and languaje created to Business Users
  • Corporative templates to your company
  • Advanced filters
Alerts
  • Configure your threshold
  • Mapping alerts and business rules
  • Planning actions when an event happen

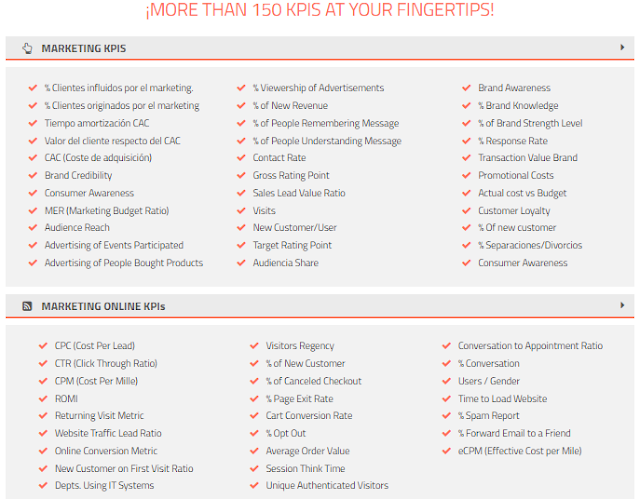
Marketing KPIs:


Check FAQs section for any question


    Machine Learning for Software Engineers, a Guide

    $
    0
    0

    Web Reporting open source based tool

    $
    0
    0
    Some new features of one of 'our favourites tools' in analytics that you can use it for Adhoc web reporting for end users. 

    You can use it 'standalone', with some BI solutions like Pentaho (check online Demo), suiteCRM, Odoo... or as a part of predefined solutions like LinceBI

    You can see STReport main new functionalities on this video including:

    - Graph support
    - Indentify cardinality of elements
    - Parameter filter for end users access
    - Cancel execution of long queries
    - Upgraded to new Pentaho versions
    - Many other minor enhacements and bugs fixed


    Las 7 personas que necesitas en tu equipo de datos

    $
    0
    0
    Great and funny data info in Lies, Damned Lies

    1. The Handyman

    Weird-Al-Handy_thumb10The Handyman can take a couple of battered, three-year-old servers, a copy of MySQL, a bunch of Excel sheets and a roll of duct tape and whip up a basic BI system in a couple of weeks. His work isn’t always the prettiest, and you should expect to replace it as you build out more production-ready systems, but the Handyman is an invaluable help as you explore datasets and look to deliver value quickly (the key to successful data projects). 
    Just make sure you don’t accidentally end up with a thousand people accessing the database he’s hosting under his desk every month for your month-end financial reporting (ahem).

    Really good handymen are pretty hard to find, but you may find them lurking in the corporate IT department (look for the person everybody else mentions when you make random requests for stuff), or in unlikely-seeming places like Finance. He’ll be the person with the really messy cubicle with half a dozen servers stuffed under his desk.
    The talents of the Handyman will only take you so far, however. If you want to run a quick and dirty analysis of the relationship between website usage, marketing campaign exposure, and product activations over the last couple of months, he’s your guy. But for the big stuff you’ll need the Open Source Guru.

    2. The Open Source Guru.

    cameron-howe_thumbI was tempted to call this person “The Hadoop Guru”. Or “The Storm Guru”, or “The Cassandra Guru”, or “The Spark Guru”, or… well, you get the idea. As you build out infrastructure to manage the large-scale datasets you’re going to need to deliver your insights, you need someone to help you navigate the bewildering array of technologies that has sprung up in this space, and integrate them.

    Open Source Gurus share many characteristics in common with that most beloved urban stereotype, the Hipster. They profess to be free of corrupting commercial influence and pride themselves on plowing their own furrow, but in fact they are subject to the whims of fashion just as much as anyone else. Exhibit A: The enormous fuss over the world-changing effects of Hadoop, followed by the enormous fuss over the world-changing effects of Spark. Exhibit B: Beards (on the men, anyway).

    So be wary of Gurus who ascribe magical properties to a particular technology one day (“Impala’s, like, totally amazing”), only to drop it like ombre hair the next (“Impala? Don’t even talk to me about Impala. Sooooo embarrassing.”) Tell your Guru that she’ll need to live with her recommendations for at least two years. That’s the blink of an eye in traditional IT project timescales, but a lifetime in Internet/Open Source time, so it will focus her mind on whether she really thinks a technology has legs (vs. just wanting to play around with it to burnish her resumé).


    3. The Data Modeler 

    ErnoCube_thumb9
    While your Open Source Guru can identify the right technologies for you to use to manage your data, and hopefully manage a group of developers to build out the systems you need, deciding what to put in those shiny distributed databases is another matter. This is where the Data Modeler comes in.
    The Data Modeler can take an understanding of the dynamics of a particular business, product, or process (such as marketing execution) and turn that into a set of data structures that can be used effectively to reflect and understand those dynamics.

    Data modeling is one of the core skills of a Data Architect, which is a more identifiable job description (searching for “Data Architect” on LinkedIn generates about 20,000 results; “Data Modeler” only generates around 10,000). And indeed your Data Modeler may have other Data Architecture skills, such as database design or systems development (they may even be a bit of an Open Source Guru). 
    But if you do hire a Data Architect, make sure you don’t get one with just those more technical skills, because you need datasets which are genuinely useful and descriptive more than you need datasets which are beautifully designed and have subsecond query response times (ideally, of course, you’d have both). And in my experience, the data modeling skills are the rarer skills; so when you’re interviewing candidates, be sure to give them a couple of real-world tests to see how they would actually structure the data that you’re working with.

    4. The Deep Diver

    diver_thumb3Between the Handyman, the Open Source Guru, and the Data Modeler, you should have the skills on your team to build out some useful, scalable datasets and systems that you can start to interrogate for insights. But who to generate the insights? Enter the Deep Diver.
    Deep Divers (often known as Data Scientists) love to spend time wallowing in data to uncover interesting patterns and relationships. A good one has the technical skills to be able to pull data from source systems, the analytical skills to use something like R to manipulate and transform the data, and the statistical skills to ensure that his conclusions are statistically valid (i.e. he doesn’t mix up correlation with causation, or make pronouncements on tiny sample sizes). As your team becomes more sophisticated, you may also look to your Deep Diver to provide Machine Learning (ML) capabilities, to help you build out predictive models and optimization algorithms.

    If your Deep Diver is good at these aspects of his job, then he may not turn out to be terribly good at taking direction, or communicating his findings. For the first of these, you need to find someone that your Deep Diver respects (this could be you), and use them to nudge his work in the right direction without being overly directive (because one of the magical properties of a really good Deep Diver is that he may take his analysis in an unexpected but valuable direction that no one had thought of before).
    For the second problem – getting the Deep Diver’s insights out of his head – pair him with a Storyteller (see below).

    5. The Storyteller

    woman_storytellerThe Storyteller’s yin is to the Deep Diver’s yang. Storytellers love explaining stuff to people. You could have built a great set of data systems, and be performing some really cutting-edge analysis, but without a Storyteller, you won’t be able to get these insights out to a broad audience.
    Finding a good Storyteller is pretty challenging. You do want someone who understands data quite well, so that she can grasp the complexities and limitations of the material she’s working with; but it’s a rare person indeed who can be really deep in data skills and also have good instincts around communications.

    The thing your Storyteller should prize above all else is clarity. It takes significant effort and talent to take a complex set of statistical conclusions and distil them into a simple message that people can take action on. Your Storyteller will need to balance the inherent uncertainty of the data with the ability to make concrete recommendations.
    Another good skill for a Storyteller to have is data visualization. Some of the most light bulb-lighting moments I have seen with data have been where just the right visualization has been employed to bring the data to life. If your Storyteller can balance this skill (possibly even with some light visualization development capability, like using D3.js; at the very least, being a dab hand with Excel and PowerPoint or equivalent tools) with her narrative capabilities, you’ll have a really valuable player.

    There’s no one place you need to go to find Storytellers – they can be lurking in all sorts of fields. You might find that one of your developers is actually really good at putting together presentations, or one of your marketing people is really into data. You may also find that there are people in places like Finance or Market Research who can spin a good yarn about a set of numbers – poach them.

    6. The Snoop 

    Jimmy_Stewart_Rear_Window_thumb6
    These next two people – The Snoop and The Privacy Wonk – come as a pair. Let’s start with the Snoop. Many analysis projects are hampered by a lack of primary data – the product, or website, or marketing campaign isn’t instrumented, or you aren’t capturing certain information about your customers (such as age, or gender), or you don’t know what other products your customers are using, or what they think about them.

    The Snoop hates this. He cannot understand why every last piece of data about your customers, their interests, opinions and behaviors, is not available for analysis, and he will push relentlessly to get this data. He doesn’t care about the privacy implications of all this – that’s the Privacy Wonk’s job.
    If the Snoop sounds like an exhausting pain in the ass, then you’re right – this person is the one who has the team rolling their eyes as he outlines his latest plan to remotely activate people’s webcams so you can perform facial recognition and get a better Unique User metric. But he performs an invaluable service by constantly challenging the rest of the team (and other parts of the company that might supply data, such as product engineering) to be thinking about instrumentation and data collection, and getting better data to work with.

    The good news is that you may not have to hire a dedicated Snoop – you may already have one hanging around. For example, your manager may be the perfect Snoop (though you should probably not tell him or her that this is how you refer to them). Or one of your major stakeholders can act in this capacity; or perhaps one of your Deep Divers. The important thing is not to shut the Snoop down out of hand, because it takes relentless determination to get better quality data, and the Snoop can quarterback that effort. And so long as you have a good Privacy Wonk for him to work with, things shouldn’t get too out of hand.

    7. The Privacy Wonk 
    Sadness_InsideOut_2815
    The Privacy Wonk is unlikely to be the most popular member of your team, either. It’s her job to constantly get on everyone’s nerves by identifying privacy issues related to the work you’re doing.
    You need the Privacy Wonk, of course, to keep you out of trouble – with the authorities, but also with your customers. There’s a large gap between what is technically legal (which itself varies by jurisdiction) and what users will find acceptable, so it pays to have someone whose job it is to figure out what the right balance between these two is. 

    But while you may dread the idea of having such a buzz-killing person around, I’ve actually found that people tend to make more conservative decisions around data use when they don’t have access to high-quality advice about what they can do, because they’re afraid of accidentally breaking some law or other. So the Wonk (much like Sadness) turns out to be a pretty essential member of the team, and even regarded with some affection.

    Of course, if you do as I suggest, and make sure you have a Privacy Wonk and a Snoop on your team, then you are condemning both to an eternal feud in the style of the Corleones and Tattaglias (though hopefully without the actual bloodshed). But this is, as they euphemistically say, a “healthy tension” – with these two pulling against one another you will end up with the best compromise between maximizing your data-driven capabilities and respecting your users’ privacy.

    Bonus eighth member: The Cat Herder (you!)The one person we haven’t really covered is the person who needs to keep all of the other seven working effectively together: To stop the Open Source Guru from sneering at the Handyman’s handiwork; to ensure the Data Modeler and Deep Diver work together so that the right measures and dimensionality are exposed in the datasets you publish; and to referee the debates between the Snoop and the Privacy Wonk. 

    This is you, of course – The Cat Herder. If you can assemble a team with at least one of the above people, plus probably a few developers for the Open Source Guru to boss about, you’ll be well on the way to unlocking a ton of value from the data in your organization.


    Visto en: Lies, Damned Lies

    Working together PowerBI with the best open source solutions

    $
    0
    0

    Here you can see a nice sample combining PowerBI with open source based Business Intelligence solutions, like LinceBI, in order to provide the most complete BI solution with an affordable cost

    - Predefined Dashboards
    - Adhoc Reporting
    - OLAP Analysis
    - Adhoc Dashboarding
    - Scorecards

    More info:
    - PowerBI functionalities
    - PowerBI training

    Una Wikipedia para la visualización de datos

    $
    0
    0

    Si alguna vez tienes dudas sobre cual es el mejor tipo de gráfico para usar en cada ocasión, puedes echar un vistazo a the Data Viz Project, en donde tienes más de 150 gráficos explicados y la mejor forma de usarles y sacar partido.

    Una de las mejores partes de la web es donde se muestran ejemplos reales de aplicación práctica de cada uno de los gráficos:


    30 años del Data Warehouse

    Un glosario de los 7 principales terminos de Machine Learning

    $
    0
    0

    Machine learning


    Machine learning is the process through which a computer learns with experience rather than additional programming.
    Let’s say you use a program to determine which customers receive which discount offers. If it’s a machine-learning program, it will make better recommendations as it gets more data about how customers respond. The system gets better at its task by seeing more data.

    Algorithm


    An algorithm is a set of specific mathematical or operational steps used to solve a problem or accomplish a task.
    In the context of machine learning, an algorithm transforms or analyzes data. That could mean:
    • performing regression analysis—“based on previous experiments, every $10 we spend on advertising should yield $14 in revenue”
    • classifying customers—“this site visitor’s clickstream suggests that he’s a stay-at-home dad”
    • finding relationships between SKUs—“people who bought these two books are very likely to buy this third title”
    Each of these analytical tasks would require a different algorithm.
    When you put a big data set through an algorithm, the output is typically a model.

    Model


    The simplest definition of a model is a mathematical representation of relationships in a data set.
    A slightly expanded definition: “a simplified, mathematically formalized way to approximate reality (i.e. what generates your data) and optionally to make predictions from this approximation.”
    Here’s a visualization of a really simple model, based on only two variables.
    The blue dots are the inputs (i.e. the data), and the red line represents the model.

    I can use this model to make predictions. If I put any “ad dollars spent” amount into the model, it will yield a predicted “revenue generated” amount.
    Two key things to understand about models:
    1. Models get complicated. The model illustrated here is simple because the data is simple. If your data is more complex, the predictive model will be more complex; it likely wouldn’t be portrayed on a two-axis graph.
    When you speak to your smartphone, for example, it turns your speech into data and runs that data through a model in order to recognize it. That’s right, Siri uses a speech recognition model to determine meaning.
    Complex models underscore why machine-learning algorithms are necessary: You can use them to identify relationships you would never be able to catch by “eyeballing” the data.
    2. Models aren’t magic. They can be inaccurate or plain old wrong for many reasons. Maybe I chose the wrong algorithm to generate the model above. See the line bending down, as you pass our last actual data point (blue dot)? It indicates that this model predicts that past that point, additional ad spending will generate less overall revenue. This might be true, but it certainly seems counterintuitive. That should draw some attention from the marketing and data science teams.
    A different algorithm might yield a model that predicts diminishing incremental returns, which is quite different from lower revenue.

    Features


    Wikipedia’s definition of a feature is good: “an individual measurable property of a phenomenon being observed. Choosing informative, discriminating, and independent features is a crucial step for effective algorithms.”
    So features are elements or dimensions of your data set.
    Let’s say you are analyzing data about customer behavior. Which features have predictive value for the others? Features in this type of data set might include demographics such as age, location, job status, or title, and behaviors such as previous purchases, email newsletter subscriptions, or various dimensions of website engagement.
    You can probably make intelligent guesses about the features that matter to help a data scientist narrow her work. On the other hand, she might analyze the data and find “informative, discriminating, and independent features” that surprise you.

    Supervised vs. unsupervised learning


    Machine learning can take two fundamental approaches.
    Supervised learning is a way of teaching an algorithm how to do its job when you already have a set of data for which you know “the answer.”
    Classic example: To create a model that can recognize cat pictures via a supervised learning process, you would show the system millions of pictures already labeled “cat” or “not cat.”
    Marketing example: You could use a supervised learning algorithm to classify customers according to six personas, training the system with existing customer data that is already labeled by persona.
    Unsupervised learning is how an algorithm or system analyzes data that isn’t labeled with an answer, then identifies patterns or correlations.
    An unsupervised-learning algorithm might analyze a big customer data set and produce results indicating that you have 7 major groups or 12 small groups. Then you and your data scientist might need to analyze those results to figure out what defines each group and what it means for your business.
    In practice, most model building uses a combination of supervised and unsupervised learning, says Doyle.

    “Frequently, I start by sketching my expected model structure before reviewing the unsupervised machine-learning result,” he says. “Comparing the gaps between these models often leads to valuable insights.”

    Deep learning


    Deep learning is a type of machine learning. Deep-learning systems use multiple layers of calculation, and the later layers abstract higher-level features. In the cat-recognition example, the first layer might simply look for a set of lines that could outline a figure. Subsequent layers might look for elements that look like fur, or eyes, or a full face.

    Compared to a classical computer program, this is somewhat more like the way the human brain works, and you will often see deep learning associated with neural networks, which refers to a combination of hardware and software that can perform brain-style calculation.

    It’s most logical to use deep learning on very large, complex problems. Recommendation engines (think Netflix or Amazon) commonly use deep learning.

    Visto en Huffingtonpost

    Comparativa Kettle (Pentaho Data Integration) y Talend

    $
    0
    0
    Hace unos días os hablábamos de que el ETL es crucial y hoy os mostramos una comparativa de las dos mejores herramientas Open Source de ETL (Kettle de Pentaho y Talend), que tampoco empieza a ser arriesgado a decir que se están convirtiendo en las mejores, sobre todo si valoramos el coste y la posibilidad de integración y modificación respecto a Informatica Powercenter, Oracle, Microsoft o IBM

    Tanto Kettle como Talend son grandes herramientas, muy visuales, que nos permiten integrar todo tipo de fuentes, incluyendo también Big Data para hacer todo tipo de transformaciones y proyectos de integración o para preparar potentes entornos analíticos, también con soluciones Open Source como podéis ver en esta Demo Online, donde se han usado Kettle y Talend en el backend


    Descargar la comparativa de Excella 

    How to create Web Dashboards from Excel

    $
    0
    0

    Now, you can create powerful Dashboards from excel for end users, with no single line of code. Just in seconds!! with STAgile, an open source based solution, with no licenses.

    The best tool for non technical end users.


    All the modules you can find in LinceBI are the right solution if you don´t want to pay licenses and you need profesional support

    Besides, you have 'predefined industry oriented solutions', with a lot of KPIs, Dashboards, reports...


    You can use STAgile, standalone or embed in your web application


    Benchmarking 20 Machine Learning Models Accuracy and Speed

    $
    0
    0

    As Machine Learning tools become mainstream, and ever-growing choice of these is available to data scientists and analysts, the need to assess those best suited becomes challenging. In this study, 20 Machine Learning models were benchmarked for their accuracy and speed performance on a multi-core hardware, when applied to 2 multinomial datasets differing broadly in size and complexity. 

    See Study

    It was observed that BAG-CART, RF and BOOST-C50 top the list at more than 99% accuracy while NNET, PART, GBM, SVM and C45 exceeded 95% accuracy on the small Car Evaluation dataset


    Visto en Rpubs

    Dear Data, arte en la visualizacion

    $
    0
    0

    Os recomendamos esta gran iniciativa, Dear Data, de Giorgia Lupi y Stefanie Posavec

    Se trata de un libro colaborativo en el envío de cartas que convierte a los imagenes en arte y elegancia. Muy recomendable!!


    Si estas en Peru, programa de BigData, Machine Learning & Business Intelligence

    $
    0
    0


    Este interesante Curso supone una de las primeras participaciones de la compañía especialista en Analytics, Stratebi en Perú, en donde hay un gran interés en estas tecnologías y ya se están acometiendo algunos proyectos interesantes

    Objetivo

    Al finalizar el programa los estudiantes podrán:


    • Evaluar los fundamentos y conceptualizaciones que rigen las tecnologías del Data Science, BigData, Machine Learning & Business Intelligence.
    • Desarrollar soluciones de Business Intelligence mediante aplicaciones de BigData a través de Pentaho.
    • Desarrollar soluciones de Business Intelligence mediante aplicaciones de Machine Learning a través de Python, Apache Mahout, Spark y MLib.
    • Desarrollar Dashboards y soluciones de Data Visualization y Data Discovery.
    • Evaluar la calidad de los proyectos IT& Data Science enfocados a Business Intelligence.
    • Gestionar proyectos de Data Science, BigData, Machine Learning & Business Intelligence.
    • Aplicar las herramientas más avanzadas IT & Data Science para la creación de soluciones estructuradas de BI enfocadas a las ciencias, ingeniería y negocios.


    Dirigido a: 

    Profesionales de las tecnologías de información, gestores de TI, analistas de negocio, analistas de sistemas, arquitectos Java, desarrolladores de sistemas, administradores de bases de datos, desarrolladores y profesionales con relación al área de tecnología, marketing, negocio y financiera.


    Web Reporting open source based tool updated features

    $
    0
    0
    Some new features of one of 'our favourites tools' in analytics that you can use it for Adhoc web reporting for end users with no licenses and professional support

    You can use it 'standalone', with some BI solutions like Pentaho (check online Demo), suiteCRM, Odoo... or as a part of predefined solutions like LinceBI

    You can see STReport main new functionalities on this video including:

    - Graph support
    - Indentify cardinality of elements
    - Parameter filter for end users access
    - Cancel execution of long queries
    - Upgraded to new Pentaho versions
    - Many other minor enhacements and bugs fixed

    Contact info


    Main features:


    Principales tendencias de Visualizacion de Datos para 2018

    $
    0
    0


    Gracias a nuestros amigos de Carto nos llega esta interesante recopilación de las principales tendencias en Visualización de Datos para 2018

    1. Data visualization is not just for data scientists anymore.
    IBM projects a 39% increase in demand for data scientists and data engineers over the next three years. But employers are coming to expect a familiarity and comfort with data across their organizations, not just from their scientists and engineers.
    Because of this trend, we can expect the continued growth of tools and resources geared towards making the data visualization field and its benefits more accessible to everyone.
    Ferdio Data Viz
    For example, someone new to the field may turn to Ferdio’s DataVizProject.com, a compendium of over 100 visualization models. The infographic agency put this resource together to “inform and inspire” those looking to build their own data visualizations. Other services like Google’s Data Studio allow users to easily create visualizations and dashboards without coding skills.

    2. The increase of both open and private data helps enrich data visualizations.

    In order to gain greater insight into the actions and patterns of their customers and constituents, organizations need to turn to sources outside of their own proprietary data.
    Luckily for data scientists, more and more data becomes available every day, and we can expect the trend of increased availability to continue into 2018.
    Data.gov, the United States Federal Government’s open data site, boasts data sets from 43 US states, 47 cities and counties and 53 other nations. In June, Forbes identified 85 US cities that have their own data portals.
    The example above visualizes open data about Cholera outbreaks from WHOusing custom iconography and color palette.
    In addition to open data sources, new marketplaces, data exchanges such as the new Salesforce Data Studio (announced in September 2017) as well as resources such as CARTO’s Data Observatory, will provide data scientists and visualizers even more opportunities to enhance their data and draw new and actionable insights.

    3. Artificial Intelligence and Machine Learning allows data professionals to work smarter not harder.

    Artificial Intelligence and Machine Learning are the buzz words du jour in the tech world and that includes their use in the field of data science and visualization.
    Salesforce has certainly highlighted their use, advertising their Einstein AI, which will aid users in discovering patterns in their data.
    Einstein AI
    Microsoft has recently announced similar enhancements to Excel, expected in 2018. Their “Insights” upgrade includes the creation of new data types in the program. For example, the Company Name data type will automatically pull in such information as location and population data using their Bing API. They are also introducing Machine Learning models that will assist with data manipulation. These updates will empower Excel users, already familiar with the programs data visualization tools, with data sets that are automatically enhanced.

    4. The “interactive map” is becoming a standard medium for data visualizations.

    Data visualization, as a term, can refer to any visual representation of data. However, with the growing amount and prevalence of location data, more and more data visualizations require an interactive map to fully tell a story with data.
    Data Visualizations

    5. There is a new focus on “data stories.”

    Creating a single data visualization can have great impact. But, more companies are beginning to create custom website experiences that tell a more complete story using many types of data and visualization methods.
    Enigma Labs released the world’s first Sanctions Tracker earlier this year, a data story that contextualizes and communicates over twenty years of U.S. sanctions data as meaningful information. Look in 2018 for more custom experiences that use maps and other mediums of data visualization to communicate complex issues.
    Sanctions Tracker Map

    6. New color schemes and palettes for visually impaired.

    The color of 2017, according to Pantone, is “Greenery,” a lighter shade of green conveying a sense of rejuvenation, restoration, and renewal. The long-term color forecast, however, is a return to primary colors like red, green, and blue, colors often appearing in country flags, because “[i]n complex times we look to restricted, uncompromising pallets.”
    Regardless of trends, it’s important to understand the fundamentals of choosing color palettes for your data visualization. Once you understand the fundamentals, you can start exploring other palette options and incorporating design trends. Check out Invision’s post on Finding The Right Color Palletes for Data Visualizations.
    CARTO also offers an open-source set of colors specifically designed for data visualizations using maps, called CARTO Colors.
    It’s important to consider that about 4.5% of the world’s population is color-blind. Data visualization designers especially need to considering building visualizations with color-blind color palettes, like those provided by ColorBrewer.

    7. Data visualizations around current events are dominating the social conversation.

    Data visualizations for social sharing will also take a “less is more” approach for the remainder of the year.
    Interactive data visualizations, and maps specifically, offer a new format that is great for social sharing. Marketers can quickly build maps using available location data from social platforms or open data portals.
    Below, one marketer created a data visualization using Twitter traffic from the Game of Thrones season seven premiere and generated thousands of views:
    In focusing in on the three main contenders for the Iron Throne, this data visualization quickly and efficiently tells the viewer that Cersei Lannister drove the most twitter activity in the twenty four hours following the premiere. A marketer could do a similar analysis using branded keyword data.

    8. Journalists are striking back with data visualizations.

    The Oxford English Dictionary selected “post-truth” as the word of 2016. Indeed, following the U.S. presidential election, data analysts, and journalists have been on the defensive from opponents labeling their reporting “fake news.”
    But 2017 is the year data analysts and journalists strike back with the help of data visualizations.
    The editors of the Columbia Journalism Review (CJR) released an editorial, titled “America’s Growing News Deserts,” in spring 2017. The article featured the interactive data visualization below that maps the dearth of local newspapers across the country.
    Viewing all 866 articles
    Browse latest View live