Quantcast
Channel: Business Intelligence y Big Data: ¡Aprende Gratis sobre Analytics!
Viewing all 866 articles
Browse latest View live

Como construir un bot conversacional con Microsoft Azure

$
0
0


Architecture

The architecture shown here uses the following Azure services. Your own bot may not use all of these services, or may incorporate additional services.

Bot logic and user experience

  • Bot Framework Service (BFS). This service connects your bot to a communication app such as Cortana, Facebook Messenger, or Slack. It facilitates communication between your bot and the user.
  • Azure App Service. The bot application logic is hosted in Azure App Service.

Bot cognition and intelligence

  • Language Understanding (LUIS). Part of Azure Cognitive Services, LUIS enables your bot to understand natural language by identifying user intents and entities.
  • Azure Search. Search is a managed service that provides a quick searchable document index.
  • QnA Maker. QnA Maker is a cloud-based API service that creates a conversational, question-and-answer layer over your data. Typically, it's loaded with semi-structured content such as FAQs. Use it to create a knowledge base for answering natural-language questions.
  • Web app. If your bot needs AI solutions not provided by an existing service, you can implement your own custom AI and host it as a web app. This provides a web endpoint for your bot to call.

Data ingestion

The bot will rely on raw data that must be ingested and prepared. Consider any of the following options to orchestrate this process:
  • Azure Data Factory. Data Factory orchestrates and automates data movement and data transformation.
  • Logic Apps. Logic Apps is a serverless platform for building workflows that integrate applications, data, and services. Logic Apps provides data connectors for many applications, including Office 365.
  • Azure Functions. You can use Azure Functions to write custom serverless code that is invoked by a trigger— for example, whenever a document is added to blob storage or Cosmos DB.

Logging and monitoring

  • Application Insights. Use Application Insights to log the bot's application metrics for monitoring, diagnostic, and analytical purposes.
  • Azure Blob Storage. Blob storage is optimized for storing massive amounts of unstructured data.
  • Cosmos DB. Cosmos DB is well-suited for storing semi-structured log data such as conversations.
  • Power BI. Use Power BI to create monitoring dashboards for your bot.

Security and governance

Quality assurance and enhancements


  • Azure DevOps. Provides many services for app management, including source control, building, testing, deployment, and project tracking.
  • VS Code A lightweight code editor for app development. You can use any other IDE with similar features.

Mas info

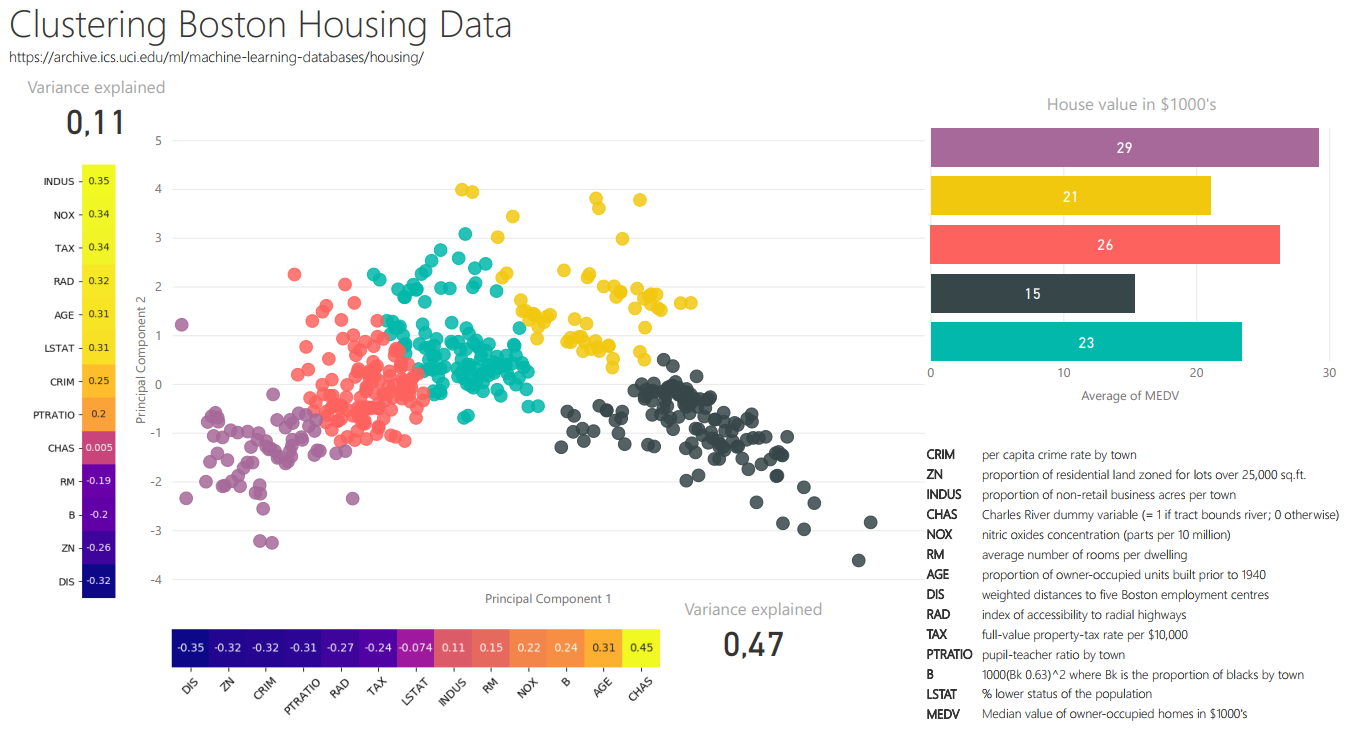
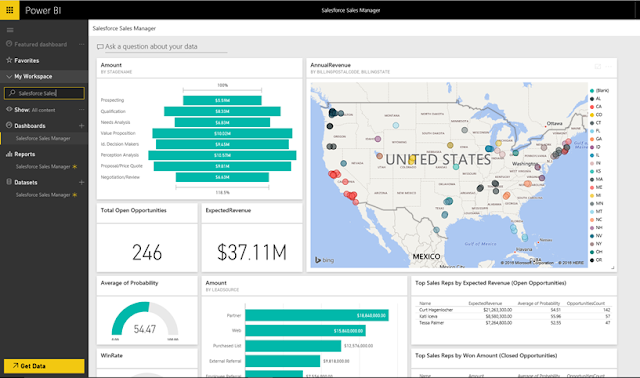
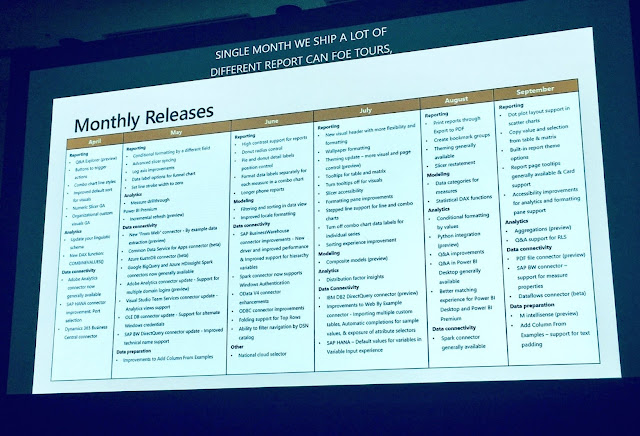
Microsoft Power BI: The future of modern BI - roadmap and vision

$
0
0


Time to check how PowerBI is improving

Talent Analytics, gestión del talento (RRHH) con Analytics y Big Data

$
0
0

Las empresas apuestan cada vez más por soluciones de business intelligence (BI) para mejorar su estrategia de negocio. Sin embargo, no se aplican con tanta frecuencia al área de Recursos Humanos, donde incluso los diferentes verticales (Formación, Laboral, Selección) no suelen cruzar datos entre sí

''Se trata de un gap de mejora que ya han comenzado a identificar las direcciones de RRHH con visión más estratégica. Es fundamental obtener una perspectiva de conjunto del área, ya que en definitiva todos los procesos empiezan o terminan en el mismo sitio: la persona, el activo más importante de toda organización y el que más condiciona su éxito'', sostiene David Martínez, socio director del Área de Transformación Digital de Watch & Act, empresa española especializada en servicios de consultoría de transformación, quien defiende la importancia de aplicar la analítica de datos a este departamento para poder alinear la gestión del talento con la estrategia de negocio, habiendo creado Talent Analytics

En este sentido, la compañía plantea una estrategia 'data driven', en la que el dato sea el que ayude a los directivos a tomar las decisiones relacionadas con la gestión del talento, y no las impresiones u otro tipo de influencias de carácter interno o externo. Gracias a la analítica de datos aplicada al departamento de Recursos Humanos es posible identificar a las personas con mayor potencial, las más comprometidas, las más rentables y, al mismo tiempo, entender mejor la organización y detectar oportunidades de mejora.
''La clave —apunta Martínez— consiste en hacerse las preguntas adecuadas para tratar de encontrar en el dato las respuestas: ¿Mis mejores comerciales son los que más formación realizan? ¿En qué tipo de perfil curricular tengo más empleados de alto potencial? ¿Qué tipo de evaluación del desempeño ayuda realmente a mejorar dicho rendimiento? ¿Obtengo mejores ratios de eficiencia en las áreas con más colaboración online? ¿Es eficaz mi proceso de acogida?''.


Con el fin de proporcionar a las empresas metodologías con las que poder obtener un análisis predictivo a partir de los procesos de retención y desarrollo del talento, Watch&Act ha desarrollado su propio modelo FourFlags de gestión de personas, que les permite fundamentar las decisiones de apostar por determinados perfiles profesionales y alinear sus resultados con la mejora de los resultados del negocio. ''Sin duda, los datos compartidos son una información de gran valor para la empresa y permiten hallar sinergias entre sus diferentes áreas de negocio que repercuten en su mejora competitiva'', precisa el socio de Watch&Act.

Alianza estratégica con Stratebi

La clave de éxito de los proyectos de business intelligence radica en la capacidad de combinar el expertise tecnológico con la visión de negocio y el conocimiento del funcionamiento sectorial. Por ello, con el fin de poder ofrecer a sus clientes un servicio diferenciador y de valor añadido en el ámbito de la analítica de datos, Watch&Act ha alcanzado una alianza estratégica con Stratebi, compañía especializada en soluciones de BI con 15 años de experiencia en empresas de ámbito internacional.

Por su parte, Watch&Act aporta su profundo conocimiento en gestión de personas y su orientación al negocio (identificación de tendencias de mercado, definición de indicadores clave, correlaciones y predicciones, diseño de proyectos piloto y valoración del retorno de la inversión). “Queremos que nuestras soluciones sean, además de punteras tecnológicamente hablando, orientadas al negocio, y que contemplen las últimas tendencias de un mercado cada vez más ágil y cambiante”, apunta David Martínez.

Ambas compañías recomiendan comenzar a implantar herramientas de analítica de datos en las verticales de las áreas de RRHH para continuar después cruzando los datos de otras áreas funcionales, como la Comercial, vinculando o correlacionando sus resultados de negocio con los esfuerzos realizados desde la Gestión de Recursos Humanos para el desarrollo de personas y equipos.


IoT Analytics and Industry 4.0

$
0
0


Cada vez más el uso de Analytics para IoT, alrededor del concepto de Industry 4.0 está suponiendo una revolución en la digitación del sector productivo e industria. El despegue del Big Data, de uso de Analytics y de tecnologías abiertas lo están haciendo posible

El gráfico superior explica muy bien estas posibilidades

En TodoBI hemos hablado bastante de IoT y su explotación con Analytics,
Incluimos algunas de las mejores soluciones open source para su uso 

Todas las presentaciones del Workshop ‘El Business Intelligence del Futuro’

$
0
0

Hace unas semanas, se celebró en Madrid el Workshop ‘El Business Intelligence del Futuro’, que organizamos desde TodoBI, con toda la sala repleta


En el, podías conocer las tecnologías líderes de integración, base de datos y visualización de Data Lakes (Talend, Vertica, PowerBI, Big Data, LinceBI...), de la mano de fabricantes, empresas que las utilizan y especialistas


Agenda:

0. Introducción al Workshop 
    1. Big Data Analytics: Concepto y arquitecturas
    • a. Definición e implantación en grandes empresas.
    • b. Business Intelligence Stack: Solución completa para la implementación de un Data Lake con Talend, Vertica y PowerBI.
    • c. Business Intelligence y Big Data Demos: Demostraciones interactivas de casos de uso usando las tecnologías anteriores.
    2. Talend: Completa herramienta de Integración ETL
    • a. Arquitectura y características principales.
    • b. Módulos ETL, Data Quality, MDM, Cloud...
    • c. Demostración práctica del funcionamiento de Talend.
    • d. Presentación de un caso de uso real con Talend.
    • e. Presente y futuro de Talend.
    3. Vertica: Tecnología columnar y MPP para el Business Intelligence y Big Data estructurado 
    • a. Arquitectura y características principales.
    • b. Demostración práctica del uso de Vertica.
    • c. Benchmark de rendimiento de. Vertica 50 veces más rápido que DB relacional.
    • d. Presentación de un caso de uso real con Vertica.
    4. Caso de uso real con Vertica y PowerBI 
      5. PowerBI: La herramienta de visualización Business Intelligence más completa y potente del mercado 
      • a. Arquitectura y características principales.
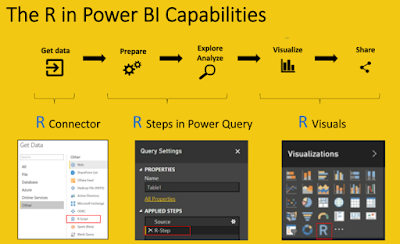
      • b. Como usar PowerBI para Machine Learning (R, Python...) y Big Data.
      • c. Demostración práctica del uso de PowerBI.
      • d. Ejemplos de uso y casos reales.


      Descargar Presentaciones:

      Desde este enlace os podéis descargar todas las presentaciones


      Enlaces a Demos:


      Whitepaper gratuito 'Usos de Machine Learning por sectores'

      $
      0
      0


      Ya tenéis disponible un Estudio muy interesante de más de 60 páginas, que os podéis descargar gratuitamente desde el enlace anterior

      Que podéis encontrar?


      Más información:

      -         Otros VideoTutoriales:

      -         Otras Presentaciones:


      Artículos interesantes sobre Machine Learning:

      Oferta de empleo Business Analytics (Business Intelligence, Big Data)

      $
      0
      0

      Nuestros compañeros de Stratebi tienen posiciones abiertas para trabajar en el campo del Business Intelligence, Big Data y Social Intelligence en Madrid y Barcelona. Si estás interesado, no dejes de echarle un vistazo y enviarnos tu CV: rrhh@stratebi.com


      Posiciones Abiertas: Septiembre 2019

       
      Debido a la ampliación de operaciones en Madrid y Barcelona, estamos buscando verdaderos apasionados por el Business Analytics y que hayan tenido interés en soluciones Open Source y en el desarrollo de tecnologías abiertas. Y, sobre todo, con ganas de aprender en nuevas tecnologías como Big Data, Social Intelligence, IoT, etc... 
      En Barcelona, podrías tener la posibilidad de teletrabajo 

      Si vienes del mundo frontend, desarrollo de visualizaciones en entornos web, también serás un buen candidato 

      Si estas leyendo estas lineas, seguro que te gusta el Business Intelligence. Estamos buscando a personas con gran interés en este área, que tengan una buena formación técnica y alguna experiencia en la implementación de proyectos Business Intelligence en importantes empresas con (PowerBI, Oracle, MySQL, Powercenter, Business Objects, Pentaho, Microstrategy...) o desarrollos web adhoc, aunque no es imprescindible.

      También se valorarán candidaturas sin experiencia profesional en este campo, pero con interés en desarrollar una carrera profesional en este área.

      Mucho mejor, si además fuera con BI Open Source, como Pentaho, Talend... y conocimientos de tecnología Big Data y Social Media, orientado a la visualización y front-end


      Nuestras camisetas te están esperando!!

      Todo ello, será muy útil para la implementación de soluciones BI/DW con la plataforma BI Open Source que está revolucionando el BI: Pentaho, con la que mas trabajamos, junto con el desarrollo de soluciones Big Data, Social Intelligence y Smart Cities, así como la nueva plataforma que hemos creado: LinceBI, adaptada a los diferentes sectores

      Si ya conoces, o has trabajado con Pentaho u otras soluciones BI Open Source será también un punto a favor. De todos modos, nuestro Plan de Formación te permitirá conocer y mantenerte actualizado en estas soluciones.


      ¿Quieres saber un poco mas sobre nosotros y las características de las personas y perfiles que estamos buscando para 'subirse al barco'?

      ¿Qué ofrecemos?


      - Trabajar en algunas de las áreas de mayor futuro y crecimiento dentro del mundo de la informática: Business Intelligence, Big Data y el Open Source.
      - Colaborar en la mejora de las soluciones Bi Open Source, entre las que se encuentran desarrollando algunas de las empresas tecnológicas más importantes.
      - Entorno de trabajo dinámico, aprendizaje continuo, variedad de retos.
      - Trabajo por objetivos.
      - Considerar el I+D y la innovación como parte principal de nuestros desarrollos.
      - Retribución competitiva.
      - Ser parte de un equipo que valora a las personas y al talento como lo más importante.


      Ya sabes, si te gusta la idea, escribenos, contando tu interés y un CV a:  rrhh@stratebi.com

      O si conoces a alguien, que crees que le podría encajar, no dudes en reenviarselo.


      Detalle de algunas tecnologías que manejamos:

      Conocimientos de Bases de datos:
      - Administracion
      - Desarrollo

      - Conocimientos de PowerBI y entornos Microsoft
      - Oracle, MySql, PostgreSQL, Vertica, Big Data

      - Conocimientos de BI y Datawarehousing con Pentaho u otros BI comerciales (BO, Powercenter, Microstrategy...)
      - Modelado de DataWarehouse
      - ETL
      - Cuadros de mando
      - Reporting, OLAP...

      - Conocimientos de linux
      - Bash scripting
      - Configuracion de servidores y servicios
      - Conocimientos de Java y J2EE
      - Tomcat
      - Spring
      - Hibernate
      - Git

      - Conocimientos Big Data y Machine Learning

      Use Case Big Data “Dashboards with Hadoop and Power BI”

      $
      0
      0


      In recent posts, we explained how to fill the gap between Big Data and OLAP, using Tableau, Pentaho and Apache Zeppelin.

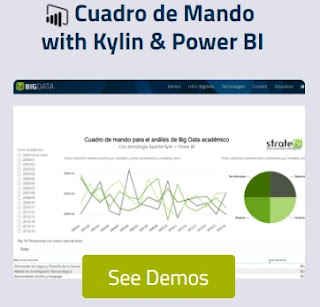
      Now, we´ll show you how to use PowerBI for Big Data Dashboards using Apache Kylin. Also try online in our Big Data Demo site


      Arquitecture:
      In this use case we have used together Apache Kylin and Power BI to support interactive data analysis (OLAP) and developing a dashboard, from data source with Big Data features (Volume, Speed, Variety).


      The data source contains the last 15 years of academic data from a big university. Over this data source, we have designed a multidimensional model with the aim of analyze student’s academic performance. We have stored in our Data Warehouse about 100 million rows, with metrics like credits, passed subjects, etc. The analysis of these facts is based on dimensions like gender, qualification, date, time or academic year.
      However this data volume is too large to be analyzed using traditional database systems for OLAP interactive analysis. To address this issue, we decide to try Apache Kylin, a new technology that promises sub second interactive queries for data Volumes over billions and trillion of rows on the fact table.
      Apache Kylin architecture is based on two Hadoop stack technologies: Apache Hive and HBase. First, we have to implement the Data Warehouse (DW) on Hive database using a star or a snow flake schemas. Once we have implemented one of these data models, we can define an OLAP cube on Kylin. 
      To this end, we have also to define a Kylin’s cube model using Kylin’s GUI with wizard. At this moment, Kylin can generate the MOLAP cube in an automatic process. After cube creation, we can query the OLAP cube using SQL queries or connecting to a BI tool using the available J/ODBC connectors.
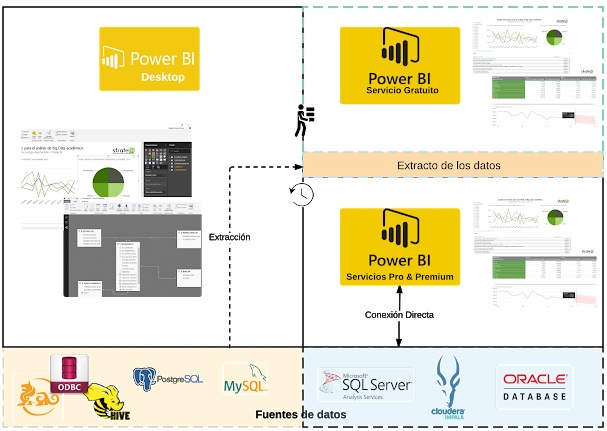
      With aim to explore the data and generate visualizations that allows users to extract useful knowledge from data, we have chosen Microsoft Power BI tools: Power BI Desktop and Power BI Service (free of charge version).
      Power BI Desktop is a completely free desktop self-service BI tool that enable users to create professional dashboards easily, dragging and dropping data concepts and charts to a new dashboard. Using this tool we have developed a dashboard, similar to our use cases with Tableau or Apache Zeppelin.
      Once designed the dashboard, we have published it on the Web with Power BI cloud service (free edition). In other to do that, we have to create an extract of the data and upload it with the dashboard.  This process is transparent to users, who also can program data refreshing frequency using Pro or Premium versions of the Power BI service (commercial tools).


      Apache Kylin:


      Developed by eBay and later released as Apache Open Source Project, Kylin is an open source analytical middle ware that supports the support analysis OLAP of big volumes of information with Big Data charactertistics, (Volume, Speed, and Variety).
      But nevertheless, until Kylin appeared in the market, OLAP technologies was limited to Relational Databases, or in some cases optimized for multidimensional storage, with serious limitations on Big Data.
      Apache Kylin, builded on top of many technologies of Hadoop environment, offer an SQL interface that allows querying data set for multidimensional analysis, achieving response time of a few seconds, over 10 millios rows.
      There are keys technologies for Kylin; Apache Hive and Apache HBase
      The Data Warehouse is based on a Start Model stored on Apache Hive. 
      Using this model and a definition of a meta-data model, Kylin builds a multidimensional MOLAP Cube in HBase. 
      After the cube is builded the users can query it, using an SQL based language with its JDBC driver.
      When Kylin receives an SQL query, decide if it can be resolved using the MOLAP cube in HBase (in milliseconds), or not, in this case Kylin build its own query and execute it in the Apache Hive Storage, this case is rarely used.
      As Kylin has a JDBC driver, we can connect it, to most popular BI tools, like Tableau, or any framework that uses JDBC.

      PowerBI:


      Power BI is a set of Business Intelligence (BI) tools created by Microsoft. Due to its simplicity and powerful, this emerging tools are becoming a leader BI technology like others such as Tableau, Pentaho or Microstrategy. 
      Like these technologies, Power BI is a self-service BI tool, extremely simple but with a lot of powerful features as the following: dashboard developing (called reports in Power BI), web and intra organization sharing and collaborative work, including dozens of powerful charts (ej. line chart with forecasting on page 2 of our demo), connection to relational and Big Data sources, support for natural language Q & A, support to execute and visualize R statistic programs or data preprocessing (ETL).
      The above features are implemented across the different tools of Power BI suite. Power BI desktop is a desktop tool for data discovery, transformation and visualization. It is a completely free tool with connectors to the most used relational and Big Data sources. Although for same data sources there are specific connectors, with Apache Kylin we have to use the ODBC connector available on Apache Kylin web page. In this way, we connect to Kylin and a data extract from data source is automatically generated by Power BI. 
      At this moment we can create our demo visualization as follows: i) define data model, ii), apply some data transformations if needed (e.g. date format), iii) generate calculated metrics (e.g. student success rate), and then, iv), create the dashboard visualization, with one or multiple pages (e.g. our demo has two page interchangeable with bottom bar selector).
      At this time, we have used Power BI service (cloud) to publish on the web our new dashboard join with data extract. To this end, we created an account of Power BI free. In this case, there are also Pro and Premium commercial editions with additional features like data extraction automatic refreshing and direct connections to some data sources such as SQL Server (also Analysis Services), Oracle or Cloudera Impala. 
      However none of these direct connectors are for Apache Kylin, then with Kylin we have to use data extraction and data extract refreshing approaches.  
      In addition to Power BI Desktop and Power BI Services (Free, Pro and Premium) there are other Power BI tools such as Power BI Mobile (access to dashboard from smartphone and collaborative work) or Power BI Embedded (to use visualizations in ad-hoc apps, web portals, etc).

      If you are interested to implement your BI company project with Power BI do not hesitate to contact us on StrateBI.


      Cual es el nivel de Big Data en tu compañía?

      $
      0
      0
      En esta infografía podéis ubicar a vuestra compañía y conocer el nivel de madurez en que se encuentra. Muy últil. 
      Para estar actualizado en Big Data, echa un vistazo a la mejor recopilación de posts sobre Big Data que hemos publicado


      Charla introducción a Apache Cassandra y NoSQL

      $
      0
      0
      Si hace unos días, os dejábamos disponibles la charla de los Open Spaces sobre Real Time Big Data con Apache Storm, hoy tenéis el video y la presentación del más que interesante de Cassandra, pieza fundamental en gran parte de los proyectos y desarrollos Big Data Analytics.
      También se realiza una breve introducción al ecosistema NoSQL. Siempre con el foco en su implementación real en proyectos y su vertiente analítica 

      Si os es útil y os gusta, no dejéis de darnos feedback para continuar con nuevos materiales


      21 nuevos puestos IT para el futuro

      $
      0
      0


      1. Data detective

      Data detectives would investigate organizational data across a company, generating meaningful business answers and recommendations based on examining information generated by Internet of Things (IoT) endpoints, devices, sensors, biometric monitors, traditional computing infrastructure, and next-gen fog, mesh, edge, and neural capabilities.

      2. Bring your own IT facilitator

      Someone in this position would be responsible for fusing an organization's shadow IT operations with its digital workplace strategy. This facilitator would create a system for visibility into on- and off-premises environments, mobile and desktop systems, and applications and services consumed by corporate users to mitigate risks.

      3. Ethical sourcing officer

      An ethical sourcing officer would lead an ethics team, and ensure that the allocation of corporate incomes aligns with the standards set by customers and employees. This person would also investigate, track, negotiate, and forge agreements around the automated provisioning of goods and services, to ensure ethical agreement with stakeholders.

      4. Artificial intelligence business development manager

      An AI business development manager would work to sell AI products to customers. This professional would work with sales, marketing, and partner teams to develop and deploy targeted AI sales and business development activities.

      5. Master of edge computing

      The master of edge computing would define a company's IoT roadmap, carefully evaluate the technical requirements needed, and assess the feasibility for establishing the edge processing unit and measure the return on investments.

      6. Walker/talker

      A walker/talker would act as a conversational companion to elderly people, connecting with seniors through a platform similar to Uber.

      7. Fitness commitment counselor

      This individual would remotely provide one-on-one regular coaching and counseling sessions to improve wellness for participants, and track their progress via wearables.

      8. AI-assisted healthcare technician

      In this role, a person would be on the road and in surgery to examine, diagnose, administer and prescribe appropriate treatment to patients, aided by the latest AI technology and remotely accessible doctors.

      9. Cyber city analyst

      A cyber city analyst would ensure the safety, security, and functionality of a city, by ensuring a steady flow of data and keeping all technical equipment functioning.

      10. Genomic portfolio director

      This individual would be a business executive with a strong commercial background, who can shape the future growth of a company's biotechnology research and ensure that new product offerings fit customers' ongoing health requirements.


      11. Man-machine teaming manager

      As humans and robots increasingly collaborate, a man-machine teaming manager would help combine the strengths of each to meet business goals.

      12. Financial wellness coach

      A financial wellness coach could offer banking customers coaching to understand digital banking options and improve their financial health.

      13. Digital tailor

      Digital tailors would go to retail customers' homes to perfect the fit and finish of their e-commerce-ordered clothes.

      14. Chief trust officer

      This professional would work alongside finance and PR teams to advise on traditional and cryptocurrency trading practices to maintain integrity and brand reputation.

      15. Quantum machine learning analyst

      Quantum machine learning analysts would research and develop innovative solutions by applying quantum technologies to improve the speed and performance of machine learning algorithms, and address real-world business problems in the fastest time possible.

      16. Virtual store sherpa

      A virtual store sherpa would assist customers with their online shopping, to help them better find the product that will meet their needs.

      17. Personal data broker

      These individuals would execute data trades on behalf of clients, and track new ways of maximizing a client's return on data.

      18. Personal memory curator

      A personal memory curator would create seamless virtual environments for elderly customers to inhabit. This person would consult with patients and stakeholders to generate specifications for virtual reality experiences that bring a particular time, place, or event to life to combat memory loss.

      19. Augmented reality journey builder

      AR journey builders would design, write, create, calibrate, gamify, and personalize the next generation of AR experiences.

      20. Highway controller

      This professional would act as a full-time space controller to regulate road and airspace in a large city by monitoring and programming AI platforms used for space management of autonomous cars and drones.

      21. Genetic diversity officer

      Beyond racial or gender diversity, a genetic diversity officer would work closely with business unit heads to ensure genetic inclusion within an organization.

      Visto en Techrepublic


      Big Data, casos, tecnologias y aplicaciones reales

      $
      0
      0

      Os mostramos a continuación, una buena selección de ejemplos, tecnologías y casos aplicables de Big Data usando las principales tecnologías, con enfoque Data Lake, de la mano de los especialistas de stratebi

      Aquí puedes probar muchas de ellas


      Free tools for Pentaho

      $
      0
      0


      Our colleagues from Stratebi (analytics specialists), have developed a suite of tools for Pentaho or embed in your own application, that includes:

      - Improvements in BI Server Console (search, tags...)
      - OLAP viewer and Adhoc Reporting improved
      - New tools for end users self service dashboarding

      - New amazing scorecard solution on top of Pentaho stack
      - Powerful predefined real time dashboards
      - Integration with Big Data technologies
      - They are free and you can get open source code

      - They only charge support, training and maintenance in order to give you security using this tools in production environments avoiding bugs, including updgrade to new versions (contact with them)
      - Forget licenses costs!!

      See in action:

      Demo_Tools - Demo Big Data


      Guia para Bases de Datos NoSQL

      $
      0
      0


      Muy interesante este articulo de Felix Gessert, donde nos ofrece una visión actualizada del paisaje actual de las Bases de Datos NoSQL y su aplicación según necesidades. Muy, muy recomendable!!

      Os incluimos también una breve introducción en español al ecosistema NoSQL, que hicieron nuestros amigos de Stratebi. Siempre con el foco en su implementación real en proyectos y su vertiente analítica. Demos Big Data Online


      Si os es útil y os gusta, no dejéis de darnos feedback para continuar con nuevos materiales


      PowerBI: Arquitectura End to End

      $
      0
      0

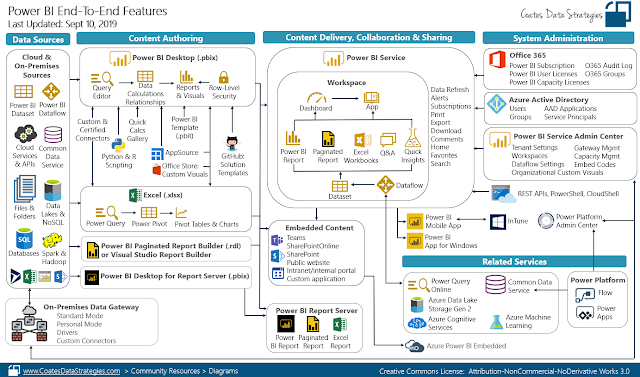
      En el diagrama superior tenéis de forma actualizada, todo el ecosistema de PowerBI. Muy útil y clarificador

      Saber más sobre PowerBI:


      Use Case Big Data “Dashboards with Hadoop and Power BI”


      In recent posts, we explained how to fill the gap between Big Data and OLAP, using Tableau, Pentaho and Apache Zeppelin. Now, we´ll show you how to use PowerBI for Big Data Dashboards using Apache Kylin. Also try online in our Big Data Demo site Arquitecture: In this use case we have used together Apache Kylin and Power BI to support interactive data analysis (OLAP) and developing a dashboard, from data source with Big Data features (Volume,...

      Todas las presentaciones del Workshop ‘El Business Intelligence del Futuro’


      Hace unas semanas, se celebró en Madrid el Workshop ‘El Business Intelligence del Futuro’, que organizamos desde TodoBI, con toda la sala repleta En el, podías conocer las tecnologías líderes de integración, base de datos y visualización de Data Lakes (Talend, Vertica, PowerBI, Big Data, LinceBI...), de la mano de fabricantes, empresas que las utilizan y especialistas Agenda: 0. Introducción al Workshop  1. Big Data Analytics:...

      Como funciona Microsoft Power BI? Todo lo que necesitas saber


      Todo lo que necesitas saber sobre la herramienta de Data Discovery que está revolucionando la toma de decisiones en las empresas lo tienes aquí: Para saber más de PowerBI (ver demos online en enlace anterior, cursos e info a continuación): Big Data para PowerBI febrero 19, 2019  big data, lincebi, open source, Pentaho, powerBi  4 comments Power BI es un conjunto de herramientas...


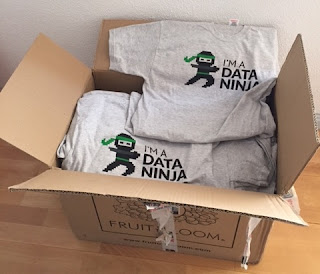
      Cool t-shirts for Analytics fans

      $
      0
      0
      Our colleagues from Stratebi have made us a very cool gift. Some t-shirts for fans of Analytics: Data Ninja, Dashboards Samurai, Data Mining Jedi, and Big Data Hulk

      Hope to share them with all our course students


      Los 30 mejores proyectos de Machine Learning Open Source

      $
      0
      0


      Como sabéis, el Machine Learning es uno de los temas que más nos interesan en el Portal y, máxime, cuando gran parte de las tecnologías son Open Source. En esta entrada, os indicamos los 30 proyectos más interesantes en en este año.

      Os dejamos también el material que publicamos con las claves del Machine Learning y una introducción

      Ver también, VideoTutorial


      No 1

      FastText: Library for fast text representation and classification. [11786 stars on Github]. Courtesy of Facebook Research


      ……….. [ Muse: Multilingual Unsupervised or Supervised word Embeddings, based on Fast Text. 695 stars on Github]

      No 2

      Deep-photo-styletransfer: Code and data for paper “Deep Photo Style Transfer” [9747 stars on Github]. Courtesy of Fujun Luan, Ph.D. at Cornell University


      No 3

      The world’s simplest facial recognition api for Python and the command line [8672 stars on Github]. Courtesy of Adam Geitgey


      No 4

      Magenta: Music and Art Generation with Machine Intelligence [8113 stars on Github].


      No 5

      Sonnet: TensorFlow-based neural network library [5731 stars on Github]. Courtesy of Malcolm Reynolds at Deepmind


      No 6

      deeplearn.js: A hardware-accelerated machine intelligence library for the web [5462 stars on Github]. Courtesy of Nikhil Thorat at Google Brain


      No 7

      Fast Style Transfer in TensorFlow [4843 stars on Github]. Courtesy of Logan Engstrom at MIT


      No 8

      Pysc2: StarCraft II Learning Environment [3683 stars on Github]. Courtesy of Timo Ewalds at DeepMind


      No 9

      AirSim: Open source simulator based on Unreal Engine for autonomous vehicles from Microsoft AI & Research [3861 stars on Github]. Courtesy of Shital Shah at Microsoft


      No 10

      Facets: Visualizations for machine learning datasets [3371 stars on Github]. Courtesy of Google Brain


      No 11

      Style2Paints: AI colorization of images [3310 stars on Github].


      No 12

      Tensor2Tensor: A library for generalized sequence to sequence models — Google Research [3087 stars on Github]. Courtesy of Ryan Sepassi at Google Brain


      No 13

      Image-to-image translation in PyTorch (e.g. horse2zebra, edges2cats, and more) [2847 stars on Github]. Courtesy of Jun-Yan Zhu, Ph.D at Berkeley


      No 14

      Faiss: A library for efficient similarity search and clustering of dense vectors. [2629 stars on Github]. Courtesy of Facebook Research


      No 15

      Fashion-mnist: A MNIST-like fashion product database [2780 stars on Github]. Courtesy of Han Xiao, Research Scientist Zalando Tech


      No 16

      ParlAI: A framework for training and evaluating AI models on a variety of openly available dialog datasets [2578 stars on Github]. Courtesy of Alexander Miller at Facebook Research


      No 17

      Fairseq: Facebook AI Research Sequence-to-Sequence Toolkit [2571 stars on Github].


      No 18

      Pyro: Deep universal probabilistic programming with Python and PyTorch [2387 stars on Github]. Courtesy of Uber AI Labs


      No 19

      iGAN: Interactive Image Generation powered by GAN [2369 stars on Github].


      No 20

      Deep-image-prior: Image restoration with neural networks but without learning [2188 stars on Github]. Courtesy of Dmitry Ulyanov, Ph.D at Skoltech


      No 21

      Face_classification: Real-time face detection and emotion/gender classification using fer2013/imdb datasets with a keras CNN model and openCV. [1967 stars on Github].


      No 22

      Speech-to-Text-WaveNet : End-to-end sentence level English speech recognition using DeepMind’s WaveNet and tensorflow [1961 stars on Github]. Courtesy of Namju Kim at Kakao Brain


      No 23

      StarGAN: Unified Generative Adversarial Networks for Multi-Domain Image-to-Image Translation [1954 stars on Github]. Courtesy of Yunjey Choi at Korea University


      No 24

      Ml-agents: Unity Machine Learning Agents [1658 stars on Github]. Courtesy of Arthur Juliani, Deep Learning at Unity3D


      No 25

      DeepVideoAnalytics: A distributed visual search and visual data analytics platform [1494 stars on Github]. Courtesy of Akshay Bhat, Ph.D at Cornell University


      No 26

      OpenNMT: Open-Source Neural Machine Translation in Torch [1490 stars on Github].


      No 27

      Pix2pixHD: Synthesizing and manipulating 2048x1024 images with conditional GANs [1283 stars on Github]. Courtesy of Ming-Yu Liu at AI Research Scientist at Nvidia


      No 28

      Horovod: Distributed training framework for TensorFlow. [1188 stars on Github]. Courtesy of Uber Engineering


      No 29

      AI-Blocks: A powerful and intuitive WYSIWYG interface that allows anyone to create Machine Learning models [899 stars on Github].


      No 30

      Deep neural networks for voice conversion (voice style transfer) in Tensorflow [845 stars on Github]. Courtesy of Dabi Ahn, AI Research at Kakao Brain


      Visto en: Medium.mybridge.com

      Comparativa de herramientas Business Intelligence

      $
      0
      0

      Os presentamos un Estudio muy completo de unas 300 páginas que han realizado nuestros compañeros especialistas en Business Intelligence, Stratebi, con una comparativa y análisis detallados de algunas de las herramientas Business Intelligence que más aceptación están teniendo ultimamente:

      - PowerBI
      - Tableau
      - Qlikview
      - Pentaho
      - SAS
      - Information Builders
      - Amazon Quicksight

      Un estudio muy completo para todos los interesados en implementar una solución business intelligence


      Guide: Machine Learning for Software Engineers

      $
      0
      0

      Las 7 personas que necesitas en tu equipo de datos

      $
      0
      0


      Great and funny data info in Lies, Damned Lies
      1. The Handyman

      Weird-Al-Handy_thumb10The Handyman can take a couple of battered, three-year-old servers, a copy of MySQL, a bunch of Excel sheets and a roll of duct tape and whip up a basic BI system in a couple of weeks. His work isn’t always the prettiest, and you should expect to replace it as you build out more production-ready systems, but the Handyman is an invaluable help as you explore datasets and look to deliver value quickly (the key to successful data projects). 
      Just make sure you don’t accidentally end up with a thousand people accessing the database he’s hosting under his desk every month for your month-end financial reporting (ahem).

      Really good handymen are pretty hard to find, but you may find them lurking in the corporate IT department (look for the person everybody else mentions when you make random requests for stuff), or in unlikely-seeming places like Finance. He’ll be the person with the really messy cubicle with half a dozen servers stuffed under his desk.
      The talents of the Handyman will only take you so far, however. If you want to run a quick and dirty analysis of the relationship between website usage, marketing campaign exposure, and product activations over the last couple of months, he’s your guy. But for the big stuff you’ll need the Open Source Guru.

      2. The Open Source Guru.

      cameron-howe_thumbI was tempted to call this person “The Hadoop Guru”. Or “The Storm Guru”, or “The Cassandra Guru”, or “The Spark Guru”, or… well, you get the idea. As you build out infrastructure to manage the large-scale datasets you’re going to need to deliver your insights, you need someone to help you navigate the bewildering array of technologies that has sprung up in this space, and integrate them.

      Open Source Gurus share many characteristics in common with that most beloved urban stereotype, the Hipster. They profess to be free of corrupting commercial influence and pride themselves on plowing their own furrow, but in fact they are subject to the whims of fashion just as much as anyone else. Exhibit A: The enormous fuss over the world-changing effects of Hadoop, followed by the enormous fuss over the world-changing effects of Spark. Exhibit B: Beards (on the men, anyway).

      So be wary of Gurus who ascribe magical properties to a particular technology one day (“Impala’s, like, totally amazing”), only to drop it like ombre hair the next (“Impala? Don’t even talk to me about Impala. Sooooo embarrassing.”) Tell your Guru that she’ll need to live with her recommendations for at least two years. That’s the blink of an eye in traditional IT project timescales, but a lifetime in Internet/Open Source time, so it will focus her mind on whether she really thinks a technology has legs (vs. just wanting to play around with it to burnish her resumé).


      3. The Data Modeler 

      ErnoCube_thumb9
      While your Open Source Guru can identify the right technologies for you to use to manage your data, and hopefully manage a group of developers to build out the systems you need, deciding what to put in those shiny distributed databases is another matter. This is where the Data Modeler comes in.
      The Data Modeler can take an understanding of the dynamics of a particular business, product, or process (such as marketing execution) and turn that into a set of data structures that can be used effectively to reflect and understand those dynamics.

      Data modeling is one of the core skills of a Data Architect, which is a more identifiable job description (searching for “Data Architect” on LinkedIn generates about 20,000 results; “Data Modeler” only generates around 10,000). And indeed your Data Modeler may have other Data Architecture skills, such as database design or systems development (they may even be a bit of an Open Source Guru). 
      But if you do hire a Data Architect, make sure you don’t get one with just those more technical skills, because you need datasets which are genuinely useful and descriptive more than you need datasets which are beautifully designed and have subsecond query response times (ideally, of course, you’d have both). And in my experience, the data modeling skills are the rarer skills; so when you’re interviewing candidates, be sure to give them a couple of real-world tests to see how they would actually structure the data that you’re working with.

      4. The Deep Diver

      diver_thumb3Between the Handyman, the Open Source Guru, and the Data Modeler, you should have the skills on your team to build out some useful, scalable datasets and systems that you can start to interrogate for insights. But who to generate the insights? Enter the Deep Diver.
      Deep Divers (often known as Data Scientists) love to spend time wallowing in data to uncover interesting patterns and relationships. A good one has the technical skills to be able to pull data from source systems, the analytical skills to use something like R to manipulate and transform the data, and the statistical skills to ensure that his conclusions are statistically valid (i.e. he doesn’t mix up correlation with causation, or make pronouncements on tiny sample sizes). As your team becomes more sophisticated, you may also look to your Deep Diver to provide Machine Learning (ML) capabilities, to help you build out predictive models and optimization algorithms.

      If your Deep Diver is good at these aspects of his job, then he may not turn out to be terribly good at taking direction, or communicating his findings. For the first of these, you need to find someone that your Deep Diver respects (this could be you), and use them to nudge his work in the right direction without being overly directive (because one of the magical properties of a really good Deep Diver is that he may take his analysis in an unexpected but valuable direction that no one had thought of before).
      For the second problem – getting the Deep Diver’s insights out of his head – pair him with a Storyteller (see below).

      5. The Storyteller

      woman_storytellerThe Storyteller’s yin is to the Deep Diver’s yang. Storytellers love explaining stuff to people. You could have built a great set of data systems, and be performing some really cutting-edge analysis, but without a Storyteller, you won’t be able to get these insights out to a broad audience.
      Finding a good Storyteller is pretty challenging. You do want someone who understands data quite well, so that she can grasp the complexities and limitations of the material she’s working with; but it’s a rare person indeed who can be really deep in data skills and also have good instincts around communications.

      The thing your Storyteller should prize above all else is clarity. It takes significant effort and talent to take a complex set of statistical conclusions and distil them into a simple message that people can take action on. Your Storyteller will need to balance the inherent uncertainty of the data with the ability to make concrete recommendations.
      Another good skill for a Storyteller to have is data visualization. Some of the most light bulb-lighting moments I have seen with data have been where just the right visualization has been employed to bring the data to life. If your Storyteller can balance this skill (possibly even with some light visualization development capability, like using D3.js; at the very least, being a dab hand with Excel and PowerPoint or equivalent tools) with her narrative capabilities, you’ll have a really valuable player.

      There’s no one place you need to go to find Storytellers – they can be lurking in all sorts of fields. You might find that one of your developers is actually really good at putting together presentations, or one of your marketing people is really into data. You may also find that there are people in places like Finance or Market Research who can spin a good yarn about a set of numbers – poach them.

      6. The Snoop 

      Jimmy_Stewart_Rear_Window_thumb6
      These next two people – The Snoop and The Privacy Wonk – come as a pair. Let’s start with the Snoop. Many analysis projects are hampered by a lack of primary data – the product, or website, or marketing campaign isn’t instrumented, or you aren’t capturing certain information about your customers (such as age, or gender), or you don’t know what other products your customers are using, or what they think about them.

      The Snoop hates this. He cannot understand why every last piece of data about your customers, their interests, opinions and behaviors, is not available for analysis, and he will push relentlessly to get this data. He doesn’t care about the privacy implications of all this – that’s the Privacy Wonk’s job.
      If the Snoop sounds like an exhausting pain in the ass, then you’re right – this person is the one who has the team rolling their eyes as he outlines his latest plan to remotely activate people’s webcams so you can perform facial recognition and get a better Unique User metric. But he performs an invaluable service by constantly challenging the rest of the team (and other parts of the company that might supply data, such as product engineering) to be thinking about instrumentation and data collection, and getting better data to work with.

      The good news is that you may not have to hire a dedicated Snoop – you may already have one hanging around. For example, your manager may be the perfect Snoop (though you should probably not tell him or her that this is how you refer to them). Or one of your major stakeholders can act in this capacity; or perhaps one of your Deep Divers. The important thing is not to shut the Snoop down out of hand, because it takes relentless determination to get better quality data, and the Snoop can quarterback that effort. And so long as you have a good Privacy Wonk for him to work with, things shouldn’t get too out of hand.

      7. The Privacy Wonk 
      Sadness_InsideOut_2815
      The Privacy Wonk is unlikely to be the most popular member of your team, either. It’s her job to constantly get on everyone’s nerves by identifying privacy issues related to the work you’re doing.
      You need the Privacy Wonk, of course, to keep you out of trouble – with the authorities, but also with your customers. There’s a large gap between what is technically legal (which itself varies by jurisdiction) and what users will find acceptable, so it pays to have someone whose job it is to figure out what the right balance between these two is. 

      But while you may dread the idea of having such a buzz-killing person around, I’ve actually found that people tend to make more conservative decisions around data use when they don’t have access to high-quality advice about what they can do, because they’re afraid of accidentally breaking some law or other. So the Wonk (much like Sadness) turns out to be a pretty essential member of the team, and even regarded with some affection.

      Of course, if you do as I suggest, and make sure you have a Privacy Wonk and a Snoop on your team, then you are condemning both to an eternal feud in the style of the Corleones and Tattaglias (though hopefully without the actual bloodshed). But this is, as they euphemistically say, a “healthy tension” – with these two pulling against one another you will end up with the best compromise between maximizing your data-driven capabilities and respecting your users’ privacy.

      Bonus eighth member: The Cat Herder (you!)The one person we haven’t really covered is the person who needs to keep all of the other seven working effectively together: To stop the Open Source Guru from sneering at the Handyman’s handiwork; to ensure the Data Modeler and Deep Diver work together so that the right measures and dimensionality are exposed in the datasets you publish; and to referee the debates between the Snoop and the Privacy Wonk. 

      This is you, of course – The Cat Herder. If you can assemble a team with at least one of the above people, plus probably a few developers for the Open Source Guru to boss about, you’ll be well on the way to unlocking a ton of value from the data in your organization.


      Visto en: Lies, Damned Lies
      Viewing all 866 articles
      Browse latest View live